How to use buoy data from NOAA and the answer is three doors: a station web page you read by eye, a flat text file you can download or pull straight into code, and a netCDF archive for anything older than about 45 days. Everything else is knowing which station to ask, what the field abbreviations mean, and checking the timestamp before you trust a single number. Set aside ten minutes and this stops being guesswork.
None of it costs anything. There is no key, no account, and no paid tier. NOAA publishes through the National Data Buoy Center (NDBC), and anyone can pull the same files you are looking at right now.
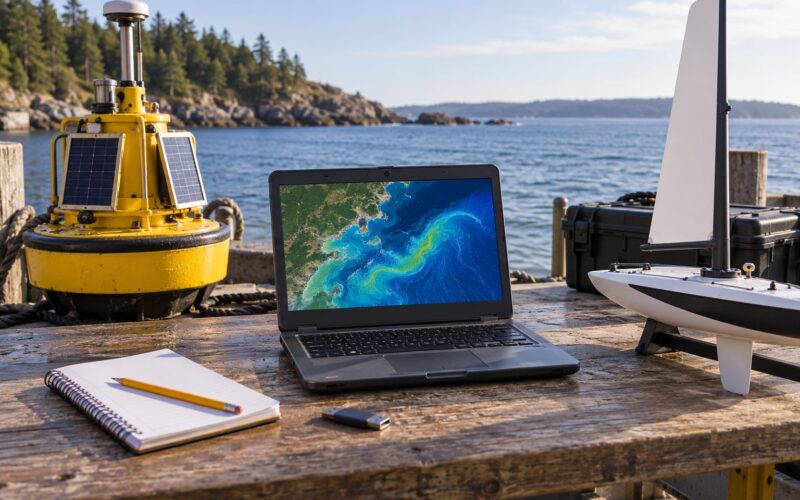
A data buoy is a floating or moored platform that measures wind, waves, water temperature, pressure and humidity on a fixed interval, then beams the readings to shore by satellite. Most report standard meteorological data every 10 minutes. Wave buoys sample far more often, because swell changes faster between reports than the wind does.
Table of Contents
- What You Need
- Step-by-Step
- Common Mistakes
- Frequently Asked Questions
- What is the easiest way to get NOAA buoy data?
- How can I find historical observations for a specific NOAA buoy?
- Is NOAA buoy data real time?
- Which NOAA buoy variables are most useful for marine robots?
- How do I compare wind and wave readings from different buoys?
- Can I use NOAA buoy data instead of a marine forecast?
- Conclusion
What You Need
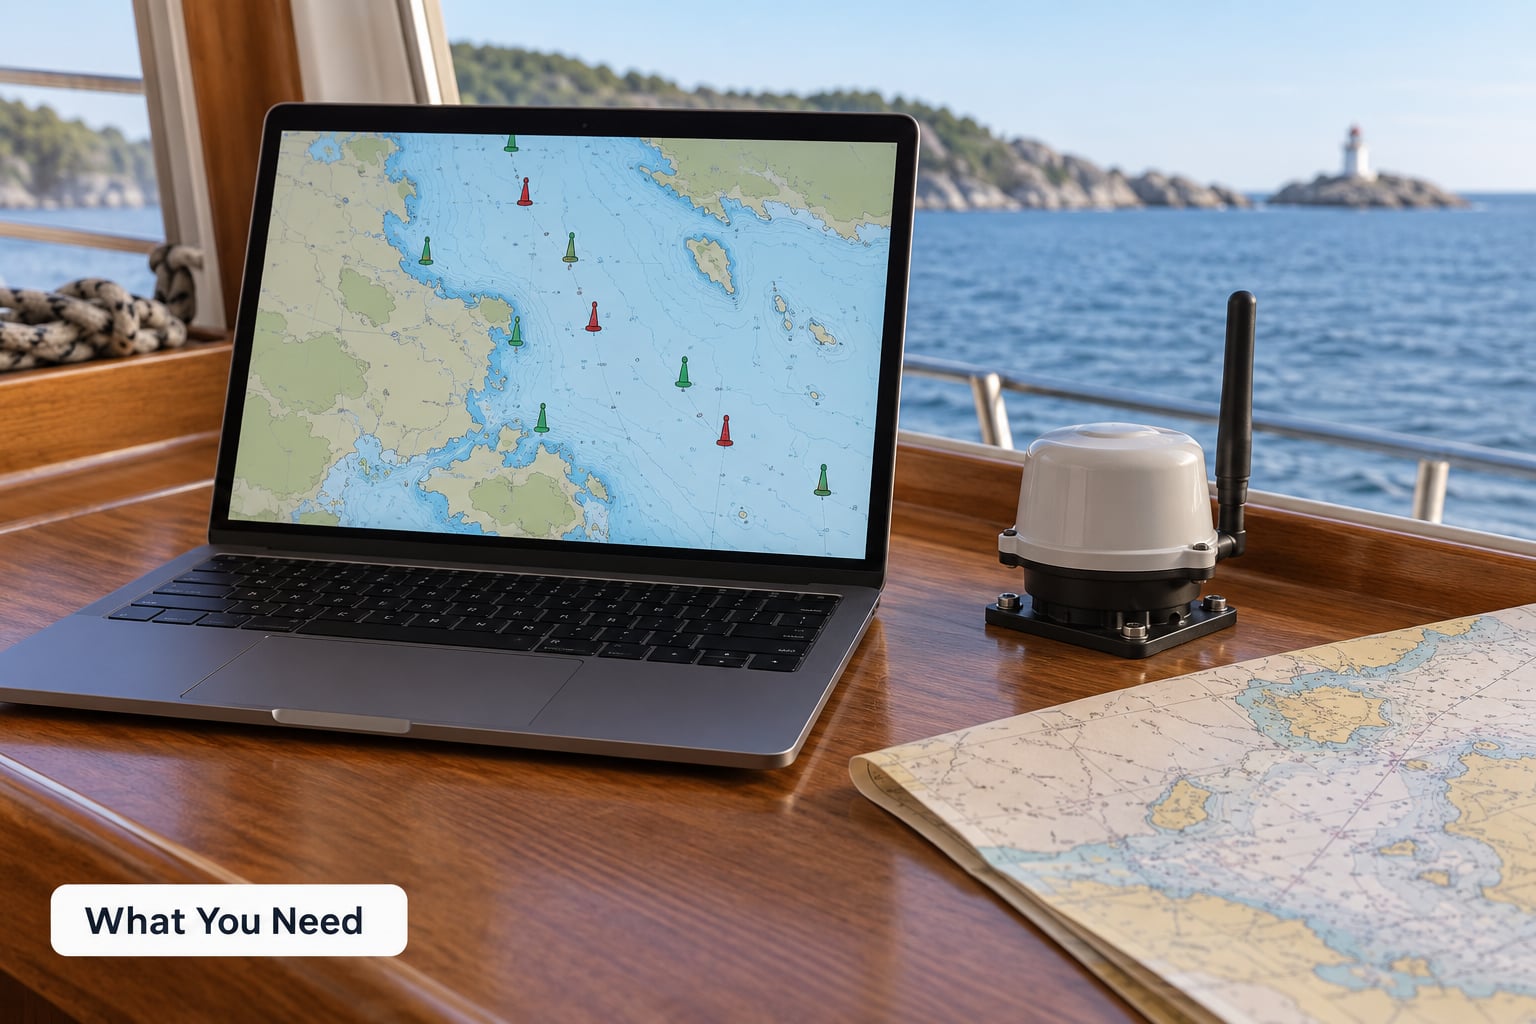
You need four things before the data makes sense: a station identifier, the field glossary, a way to fetch the file, and a habit of checking quality flags.
A station ID. Every buoy has a five-character code, and that code is the key to everything else. Point Reyes is 46029, the San Francisco Bar is 46237, Monterey is 46042. You find the code by clicking a marker on the NDBC station map, or by reading it off any page, plot or buoy report that references the station.
The field glossary. NDBC uses a fixed set of short abbreviations. Here is the set you will meet constantly.
| Field | Stands for | Reported in | What it tells you |
|---|---|---|---|
| WSPD | Wind speed | metres per second | Mean speed across the sampling interval |
| WDIR | Wind direction | degrees true | Direction the wind is blowing from |
| GST | Wind gust | metres per second | Shortest-period peak in the same interval |
| WVHT | Significant wave height | metres | Average height of the highest third of the waves |
| DPD | Dominant wave period | seconds | Period of the waves carrying the most energy |
| APD | Average wave period | seconds | Mean period across all waves, always lower than DPD |
| MWD | Mean wave direction | degrees true | Where the wave energy is coming from |
| PRES | Barometric pressure | hectopascals | Station pressure, a good falling-rising signal |
| PTDY | Pressure tendency | hectopascals | How much pressure moved over the last few hours |
| ATMP | Air temperature | degrees Celsius | Air temperature at sensor height |
| WTMP | Water temperature | degrees Celsius | Sea surface temperature at the sensor |
| DEWP | Dew point | degrees Celsius | Gap between DEWP and ATMP gives fog risk |
| VIS | Visibility | nautical miles | Reported only at a subset of coastal stations |
| TIDE | Water level | metres | Pressure-sensor reading at some stations, not a tide prediction |
| SwH / SwP / SwD | Swell height, period, direction | metres, seconds, degrees | Primary spectral partition, the clean groundswell |
| SwH2 / SwP2 / SwD2 | Secondary swell | metres, seconds, degrees | Second energy band, often local wind sea |
| STEEPNESS | Swell classification | text value | Very steep, steep, moderate, slight, or none |
One row deserves a second look. WVHT is the average of the largest one-third of waves in the sample, not the tallest wave anyone saw, which is why a 2 metre reading in practice means an occasional 3 metre face. It is also measured in open water, so a beach facing a headland sees something quite different.
A retrieval method. The same station is reachable three ways, and the right choice depends on the job.
| Method | What you get | Best for |
|---|---|---|
| Station web page | Latest reading plus plotted history, usually 45 days | A quick human check, eyeballing a trend |
| Flat text file (realtime2) | Whitespace-delimited ASCII, roughly 45 days, newest row first | Spreadsheets, scripts, alerts, dashboards |
| Historical netCDF archive | Full record, decades for long-lived stations | Climate work, model validation, seasonal studies |
Dataset families. A given station only carries one or two measurement types, which is why a perfectly good buoy can show you waves and nothing else. Each family has its own file on the station’s realtime2 directory.
| Family | Typical file | Content |
|---|---|---|
| Standard meteorological | stationid.txt | Wind, pressure, air and water temperature, waves |
| Continuous wind | stationid.cwind | Higher-frequency wind, gusts, direction |
| Peak wind | stationid.pwind | Hourly peak and hourly mean wind |
| Oceanographic | stationid.o14, stationid.o02 | Subsurface temperature, current, salinity |
| Spectral wave density | stationid.swden | Full energy spectrum, from which partitions are derived |
| ADCP | stationid.adcp | Current profile through the water column |
| DART | stationid.dart | Tsunami detection pressure and sea level |
| Water level | stationid.wlevel | Coastal sea level and water level |
A conversion reference. Everything comes out of NDBC in metric, and almost every American reference you will compare it against is not.
| From | To | Multiply or divide by |
|---|---|---|
| Metres | Feet | 3.28084 |
| Metres per second | Knots | 1.94384 |
| Metres per second | Miles per hour | 2.23694 |
| Hectopascals | Inches of mercury | divide by 33.8639 |
| Degrees Celsius | Degrees Fahrenheit | multiply by 1.8, add 32 |
| Nautical miles | Kilometres | 1.852 |
What a buoy does not measure. This trips up more beginners than anything else in the glossary. A buoy reports what the water and air are doing at one point, right now. It does not forecast tomorrow. It does not give you a tide prediction, a surf forecast, a beach break shape, or current conditions at your boat ramp. Those come from tide tables, forecast models, and coastal stations. If you need the next 24 hours, the buoy is your baseline, not your answer.
Step-by-Step
Step 1: Identify the Buoy and Its Data Source
Pick the station by geography first, then by what the station actually measures.
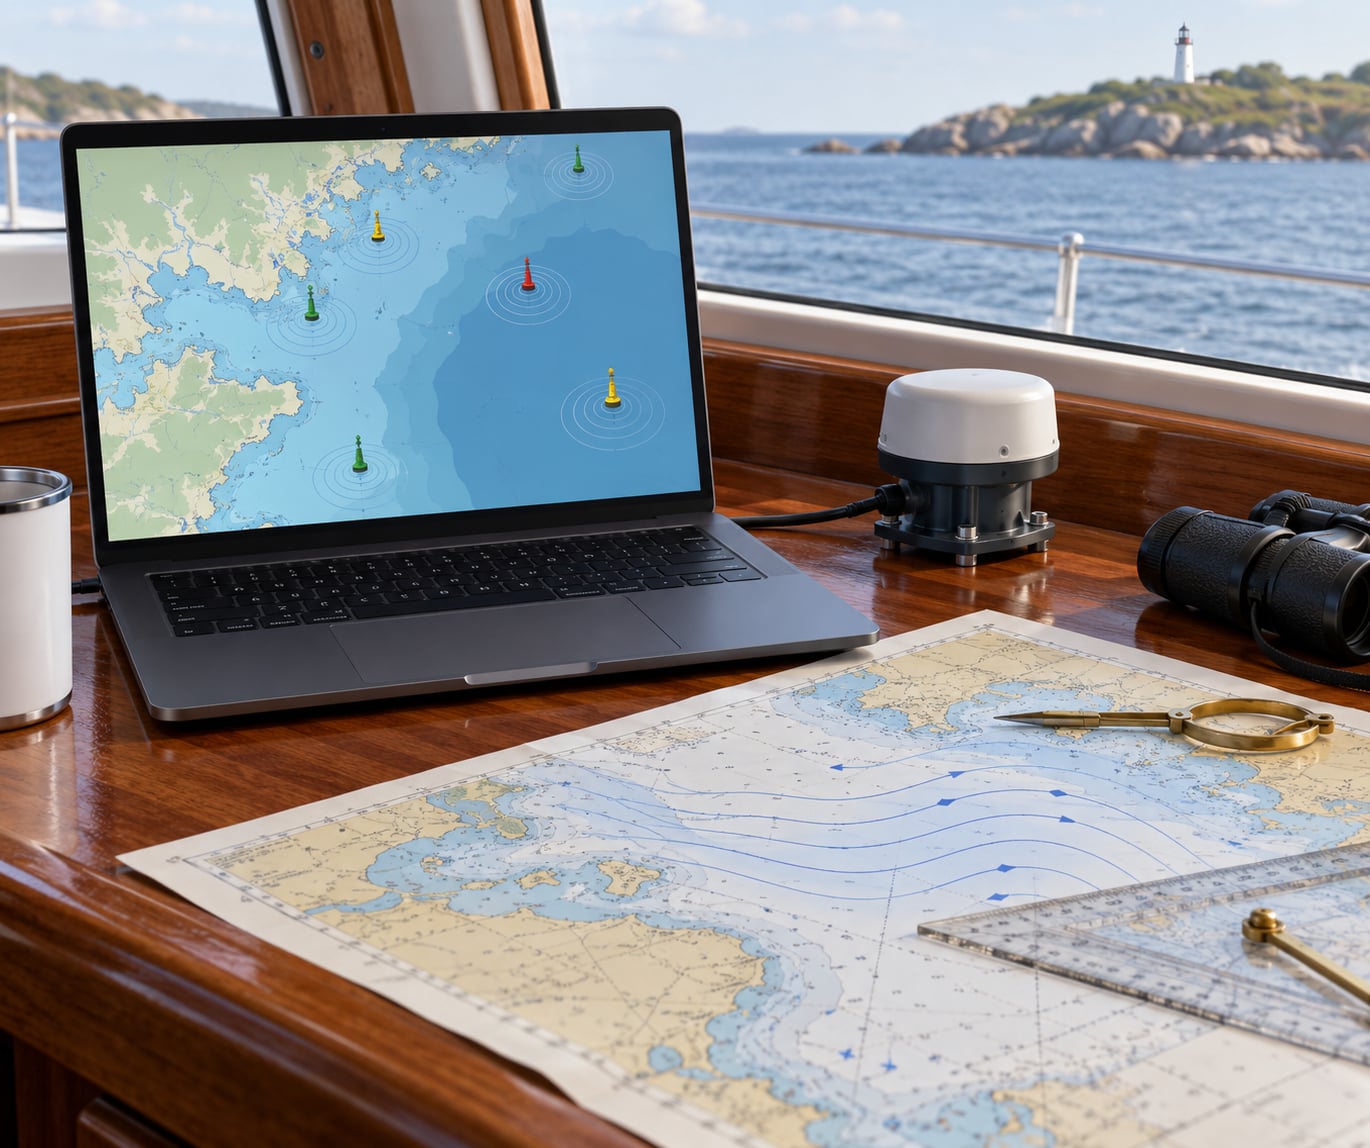
Open the NDBC map and click a marker near your area of interest. Note the station ID and its type. Moored buoys sit at fixed positions and report on a schedule, which is what you want for time series. Drifting buoys follow currents and are useful for mapping water masses rather than watching one spot. C-MAN stations are coastal towers run in partnership with the National Weather Service, and they lean toward wind, pressure and visibility rather than waves.
The offshore-versus-nearshore choice matters more than most guides admit. An offshore station reports clean open-ocean swell with no coastline in the way. A nearshore station sits in the shadow of a headland or inside a bay, so its wave numbers are smaller and more sheltered, while its wind numbers can be stronger because the coastline accelerates flow. For a test site, pick a station whose exposure matches yours, then note the difference rather than treating it as error.
Regional examples, worth confirming on the map before you rely on them, look like this:
| Region | Example station IDs | Coverage |
|---|---|---|
| West Coast | 46012, 46029, 46237, 46042, 46054 | Washington through central California, offshore and outer coast |
| East Coast | 44009, 44014, 44025, 44052 | Massachusetts to the Mid-Atlantic shelf |
| Gulf | 42036, 42040 | Central Gulf, offshore oil and shelf area |
| Alaska and the North Pacific | 46095, 46099 | Gulf of Alaska approaches |
| Great Lakes | 45001, 45005, 45007, 45008 | Inland waters, seasonally staffed and seasonally removed |
| Hawaii | 51001, 51002, 51004 | North, Northwest and Northeast Hawaiian waters |
Great Lakes stations deserve their own warning. Many are pulled or deactivated for winter and reinstated in spring, so an offline station there in January is normal rather than broken.
Step 2: Check the Observation Time and Units
Never read a buoy value without the timestamp beside it, because a stale reading looks identical to a fresh one once it lands in your code.
Standard meteorological data arrive roughly every 10 minutes, though the interval varies by station and by transmission. The text file lists rows newest first, and the timestamp columns break it into year, month, day, hour and minute. Check that the newest row is genuinely minutes old, not hours or months old.
You will also see two conventions that catch people out. Wave direction and wind direction are reported in degrees true in the northern hemisphere, and the value tells you where the energy or the wind is coming from, not where it is heading. And a current-data request can hand back a year field of 9999, which is a placeholder meaning most recent, not a typo to correct.
If it worked: your timestamp is minutes old, and you know whether you are looking at degrees true or compass points.
Step 3: Read the Main Weather and Ocean Variables
The fastest useful read is a three-field combination: DPD, then WVHT, then MWD.
Period first, because period tells you what kind of water you are dealing with. A long period around 15 seconds or more means long-travelling groundswell. A short period under 8 seconds with a low WVHT is local wind chop. A high period with a modest height is usually an early-stage swell that has not filled in yet, which is why watching the trend over a few hours tells you more than the snapshot.
Then height. WVHT near 1 metre at 14 seconds is a clean, organised swell. The same 1 metre at 6 seconds is a choppy, messy sea. Direction last, checked against the coastline you care about: a 200-degree swell may hit one beach straight and wrap into another. Add wind only for small craft, and add it from a nearshore station, since offshore wind and coastal wind are not the same number.
On a wave buoy you will also meet the spectral partitions SwH, SwP and SwD. This explains a question that comes up constantly on forums: why NOAA shows one swell figure while an app shows primary, secondary and tertiary. NOAA’s headline WVHT and DPD are properties of the whole sea surface. The partitions come from sorting the energy spectrum into bands, which is a different calculation on the same measurement. Both are legitimate, and the app is not making anything up.
Pressure, temperature and dew point do the supporting work. A falling PRES with a negative PTDY is the classic signal of an approaching front. DEWP sitting close to ATMP is a fog warning, particularly at coastal C-MAN stations.
If it worked: you can say, in one sentence, what kind of sea is present and from which quarter it arrived.
Step 4: Check Quality Flags and Data Gaps
Missing buoy values are marked with the letters MM, and reading them as zero is the single most damaging mistake in this whole workflow.
MM is a sentinel, not a measurement. It can mean the sensor failed, the station dropped off the transmission schedule, the value fell outside a sensible range, or the observation simply has not arrived yet. Set it to missing and let your analysis skip it. If you leave it as a number, averages sag, charts draw cliffs to zero, and your threshold alerts fire for no reason.
Then check the other three failure modes. A station that has been offline for a week shows a steady stream of MM with a frozen timestamp. A drifting buoy may have moved far enough that its readings no longer describe your site. And a station can carry a value in history that is absent from the latest row simply because that particular sensor is intermittent, which is normal and not a fault.
For anything serious, screen gross errors before analysis: drop wave heights below a physically sensible floor or above a survivable ceiling, flag wind gusts that exceed the recorded mean by an implausible factor, and check that consecutive timestamps advance at roughly the sampling interval.
If it worked: your dataset has honest missing values and a known last-good timestamp.
Step 5: Download and Organize the Data
The realtime2 flat text file is the fastest route from a station ID to a working table, and one line of Python does it properly.
import pandas as pd

url = "https://www.ndbc.noaa.gov/data/realtime2/46012.txt"
df = pd.read_csv(url,
                 sep=r"s+",
                 quotechar='"',
                 na_values="MM")

# Rebuild a real timestamp and sort oldest to newest
df["time"] = pd.to_datetime(df[["#YY", "MM", "DD", "hh", "mm"]])
df = df.sort_values("time")
The two arguments that matter are sep=r"s+", because the file is space-separated rather than comma-separated, and na_values="MM", which handles the missing-value sentinel in the same breath. Skip that second one and every column arrives as text type, which is the parsing error surfacing over and over in forum threads. Marking MM as missing at read time is the clean fix. If you are on an older pandas, delim_whitespace=True is the same separator written the previous way.
Adding a staleness check takes four more lines and stops you acting on a dead station.
last = df.iloc[-1]
age_hours = (pd.Timestamp.utcnow().tz_localize(None) - last["time"]).total_seconds() / 3600
if age_hours > 2:
    print(f"Stale: last observation is {age_hours:.1f} hours old")
In R, the rnoaa package wraps the same service. The year value of 9999 asks for the most recent data rather than a specific year, and the station ID is passed as text.
library(rnoaa)

target_year <- as.integer(Sys.Date()) - 2
recent  <- buoy(station = c("46012"), year = 9999)
archive <- buoy(station = c("46012"), year = target_year)
Going back further than the 45-day rolling file means the historical archive, reached through the NDBC THREDDS server and served as netCDF, often through an OPeNDAP client. It is slower and it needs a different tool, but it is the only route to multi-year records. Keep the station ID and the original timestamp in every file you save, and write down the family and format you pulled, because a file called buoy.txt with no header note is worthless in six months.
If it worked: you have a dated, typed table with station ID, source URL and a data dictionary attached.
Step 6: Compare Buoys and Make Decisions
Comparing stations is where the interesting judgement sits, and where most disagreement between sources comes from.
Start by asking why two nearby buoys disagree before assuming one is wrong. Offshore exposure, sheltering by a headland, refraction around a point, distance from the swell source, and sampling interval all produce legitimate differences. People comparing Point Reyes 46029 with the San Francisco Bar 46237 and concluding one source is unreliable are usually seeing two different coastal exposures.
Then compare like with like. Align timestamps before comparing values, because an hourly reading against a 10-minute reading will disagree for free. Normalise to the same measurement system. Use the same variable on both sides, meaning WVHT against WVHT rather than against a face-height estimate.
And keep the observation in its place. A buoy is a measurement of now, useful for a baseline, a cross-check against a model, or a sanity test on your own sensors. In a robotics context it earns its keep in three places: choosing a test site whose wave exposure matches the mission you actually want to run, setting go or no-go thresholds before a launch rather than after a failure, and comparing your own measurements against a calibrated reference during a trial. If your own wave sensor reads noticeably lower than the nearest open-water buoy in a rising swell, the first thing to suspect is your sensor, not the network.
Forecast models extend these observations forward. Use the buoy to check whether the model is currently tracking reality, and use the model for the days ahead. Neither replaces the other, and a single reading is not a trend.
If it worked: you can state the conditions, the time they were measured, the station, and how confident you are in it.
Common Mistakes
Treating a measurement as a forecast
A buoy tells you what the ocean is doing at the moment the sensor sampled. It knows nothing about tomorrow. Pull the corresponding forecast for the forward view, and describe the buoy reading as your baseline. If you act on a 10-minute-old WVHT as though it described a weekend, the error is entirely yours.
Reading MM as zero
MM means the value is not available, not that it is zero. Passing na_values="MM" to your reader handles it at the point of import. If you inherit a dataset where this was already missed, convert every MM to a null before touching anything else.
Ignoring timestamps and time bases
Rows are newest first, timestamps are split across five columns, and directions are degrees true. Sort explicitly, build a real datetime, and check the age of the newest row. Stale data masquerading as current is the most common reason a dashboard gives confidently wrong answers.
Mixing stations, datasets and measurements
Comparing a nearshore station’s sheltered wave height with an offshore station’s open-ocean figure produces a permanent, unfixable discrepancy. Compare stations with similar exposure, and always say which one a number came from. Mixing families on one station, such as standard met waves with continuous wind averages, is fine for many uses, but only once you check the time resolution differs.
Overgeneralising from one reading
A single observation has no direction, no rate of change and no history. Read the trend across several hours, and remember that a rising WVHT with a rising DPD usually means a new swell arriving and filling in, not a sudden change in conditions. For anything consequential, look at the last day or two of the record rather than the newest row.
Two habits prevent most of this. Check the newest timestamp and the MM count every time you load a file, even when you have loaded the same station a hundred times before. And keep a short note beside every dataset: station ID, retrieval date, family, format. Six months later, that note is the difference between data you can defend and data you have to re-download.
Frequently Asked Questions
What is the easiest way to get NOAA buoy data?
Open the station page on the National Data Buoy Center site and read the latest observation directly, which is the fastest route for a one-off check. For anything repeatable, download the flat text file at ndbc.noaa.gov/data/realtime2 followed by the station ID and .txt, and read it with a script. That file is whitespace-delimited text holding roughly 45 days of readings, needs no key or account, and updates as each observation arrives.
How can I find historical observations for a specific NOAA buoy?
The realtime2 text file only holds about 45 days, so anything older comes from the historical archive. The NDBC THREDDS data server distributes records as netCDF, reachable through an OPeNDAP client, and it holds the full record for long-lived stations. Note the station ID, then request that station from the archive for the years you need. Do not try to reconstruct history by repeatedly downloading the rolling file.
Is NOAA buoy data real time?
It is close to real time, with a lag. Most stations sample every 10 minutes and transmit by satellite, so an observation typically appears on the site within a few minutes of being taken. Transmission problems, satellite outages and sensor faults all add delay, and some stations are delayed-mode rather than real time. Always read the timestamp on the observation itself rather than trusting that a fresh page means a fresh reading.
Which NOAA buoy variables are most useful for marine robots?
For mission planning, WVHT, DPD, MWD, WSPD, GST and PRES are the working set. Wave height and period tell you what the vehicle and its tow system will actually be subjected to, wind speed and gust set the limit on small craft, and pressure tendency gives early warning of deteriorating weather. Water temperature matters for sensor behaviour and corrosion planning. For current work, add an ADCP family file or a nearby drifter.
How do I compare wind and wave readings from different buoys?
Compare stations with similar exposure, because an offshore and a nearshore station differ for real physical reasons rather than error. Align timestamps before comparing, since a 10-minute station and an hourly station will disagree without either being wrong. Use the same variable on both sides, normalise to one measurement system, and treat any difference you cannot explain as the first thing to investigate.
Can I use NOAA buoy data instead of a marine forecast?
No, and using it that way is a common and expensive mistake. A buoy records one point in space and time, then stops. It tells you what conditions are, which is genuinely useful as a baseline and as a check on a forecast model, but it cannot project anything forward. Pair it with the National Weather Service marine forecast and tide tables for anything beyond the present moment, and treat the buoy as the reality check on both.
Conclusion
Find the station ID closest to the water you care about, check that its newest observation is minutes old rather than hours, and confirm the variables and their measurement system before you read a single value. Download the file, convert the MM sentinels to missing data, then use the readings as the baseline for a decision and pair them with a forecast for anything further out.