Using NOAA data for a project comes down to four moves: name the question, pick the archive that actually holds the variable you need, request only the stations and dates your study area covers, then quality-check what came back before you analyze it. Nearly all of it is free and open, a few endpoints want a free email-based token, and a focused first pull takes an afternoon. The download is never the slow part. Deciding what to ask for is.
So here is how to use NOAA data for a project end to end, in the order that avoids the traps people hit most: define the question first, let the question choose the dataset, and only then open a browser form or a terminal.
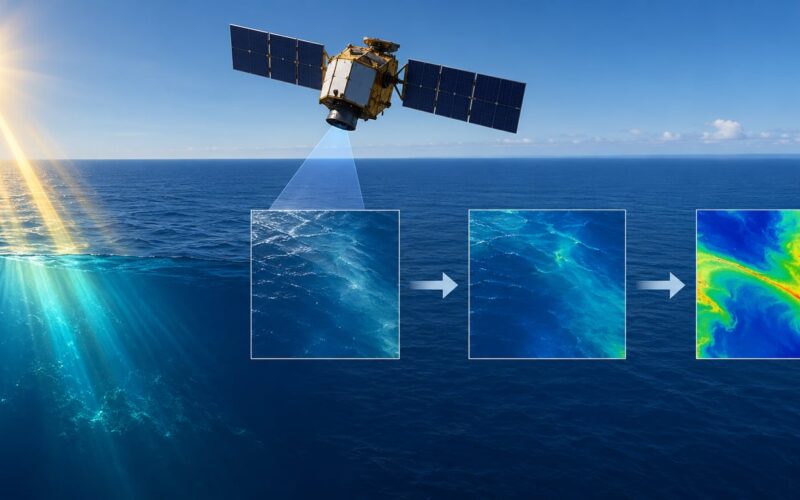
NOAA, the National Oceanic and Atmospheric Administration, runs a federation of observing systems: land stations, tide gauges, moored buoys, weather radar, polar-orbiting and geostationary satellites, and forecast models. Its data centers archive what those systems measure, and each center has its own front door. NCEI holds the long climate records, CO-OPS runs the coastal water level program, NDBC runs the buoy network, and NESDIS operates the satellites. That split is the reason no single NOAA URL has everything you might want.
Table of Contents
What You Need
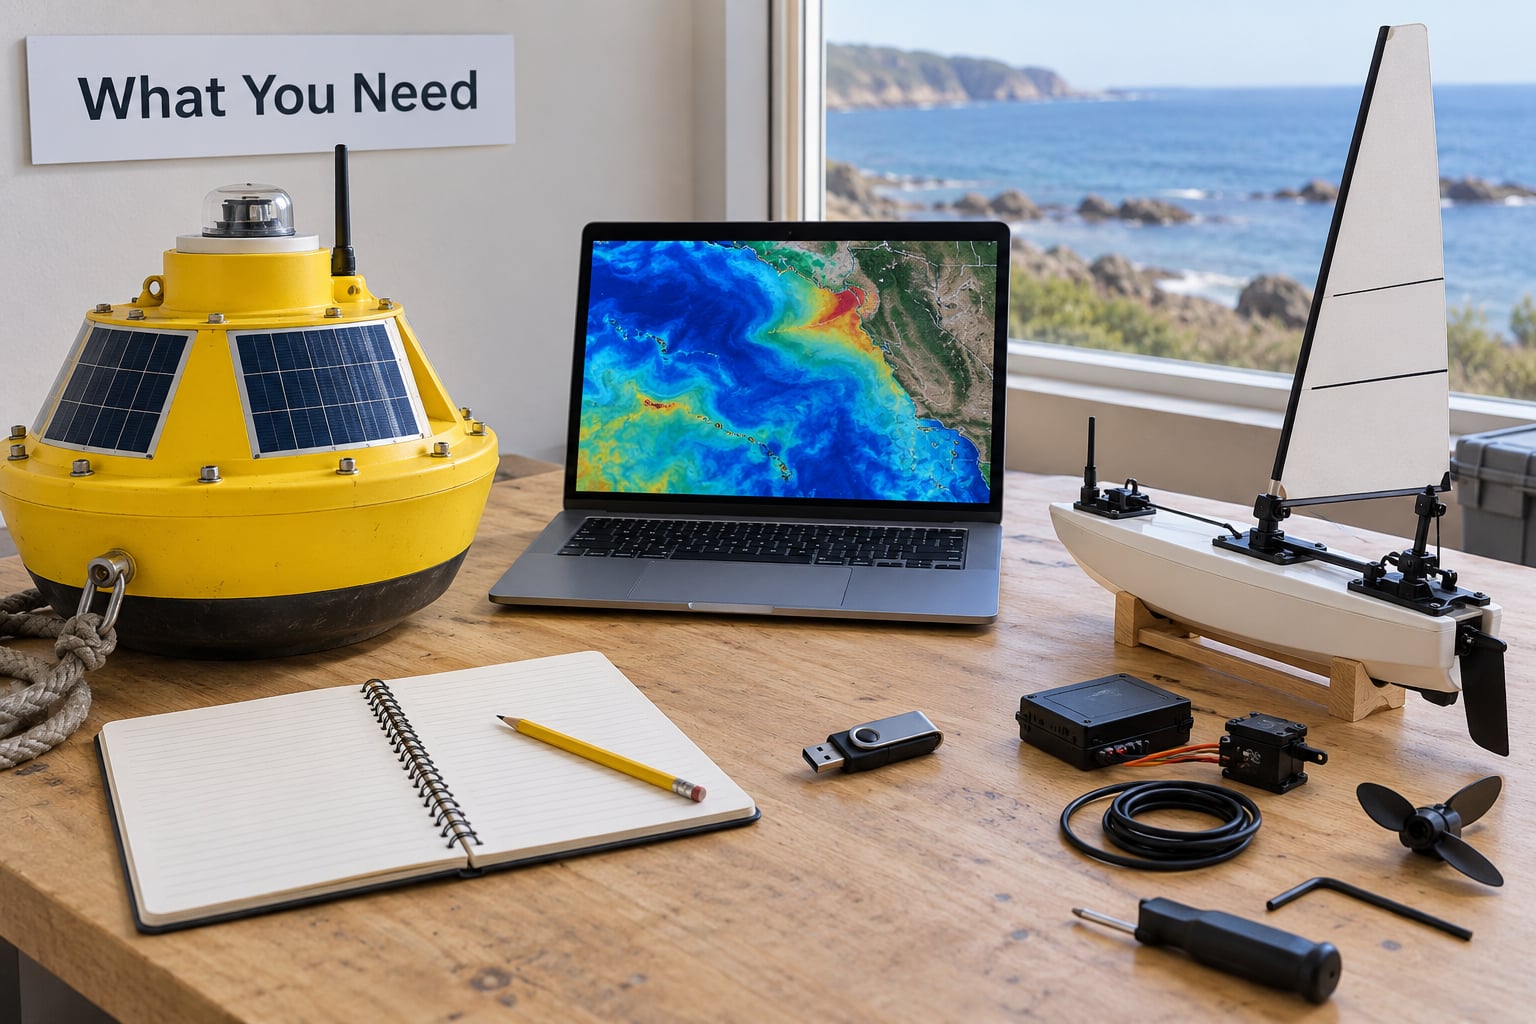
None of the following costs money. All of it is worth deciding before you open a single dataset.
- The right archive for the variable. Climate and land station records live at NCEI through Climate Data Online. Coastal water level and tide predictions live at CO-OPS. Moored buoy observations live at NDBC. Satellite and radar products come through NESDIS and the Big Data Program. If you start by browsing the wrong one, you will not find your variable by luck.
- A station list, not a guess. Almost every station-based dataset wants a station or site ID. You find those first, then request data for them. A bounding box narrows the list; it does not replace it.
- A free API token for some endpoints. The NCEI access services want a token, and you get one by entering an email address on the token page. ERDDAP, NDBC and CO-OPS bulk paths generally do not. Nothing requires a purchase, but plan ten minutes for the signup email.
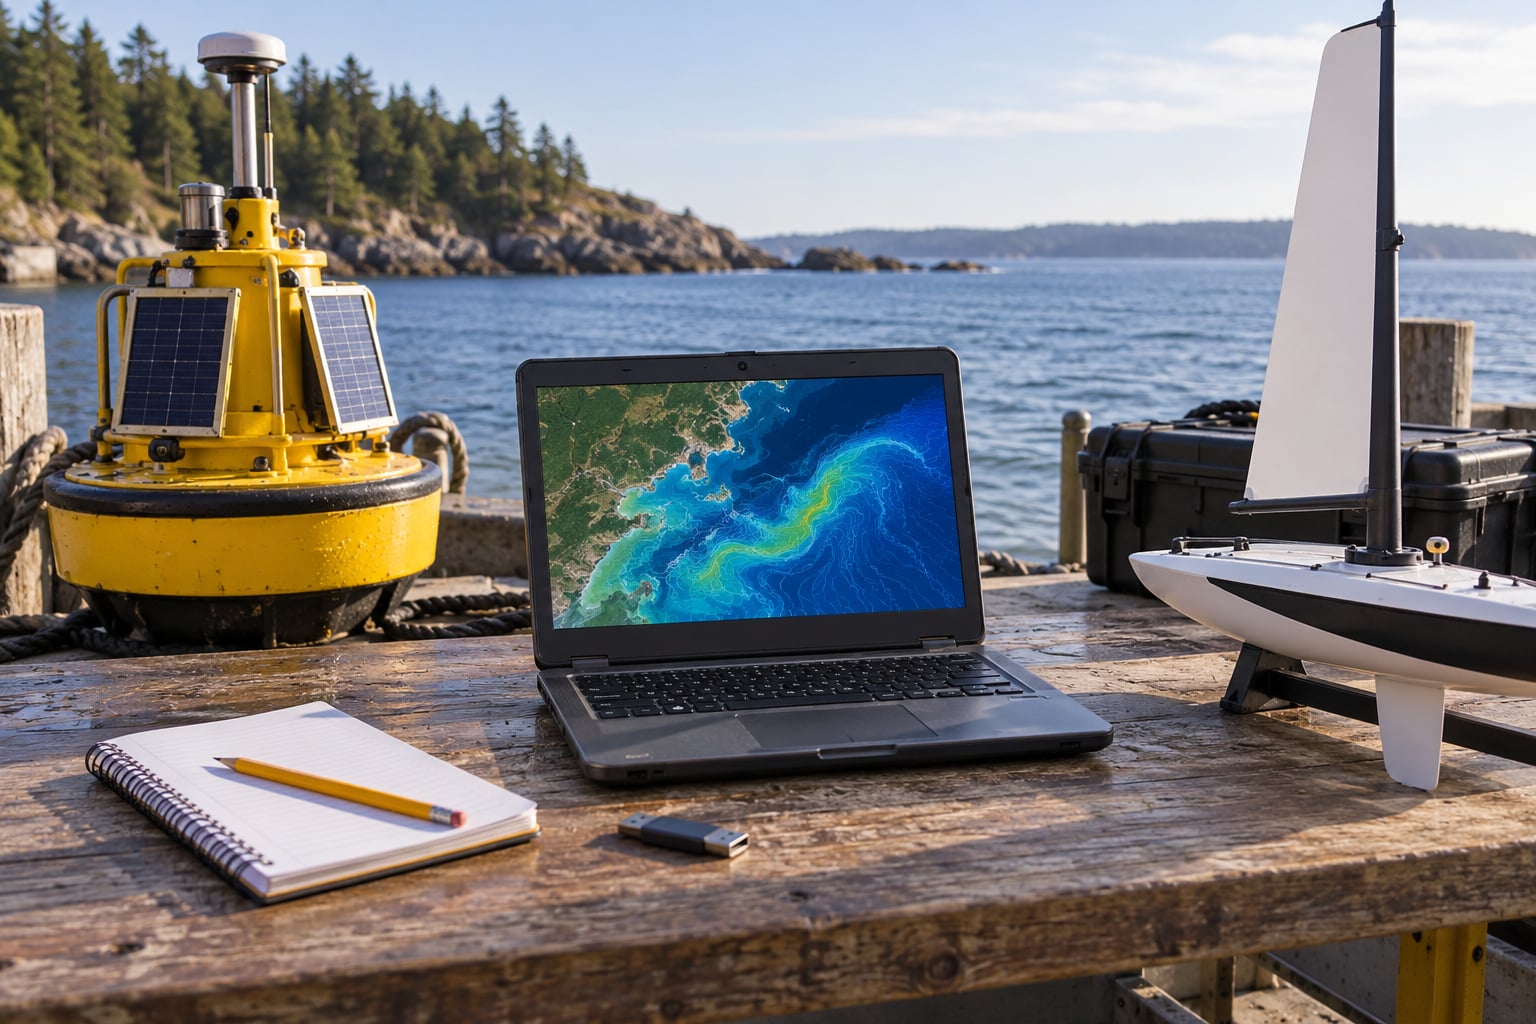
- A scratch environment. For scripted work, Python with xarray and pandas handles netCDF, CSV and gridded data well. A spreadsheet is enough for a first look at a CSV or JSON response.
- A field notebook. Write down the exact request you sent, the retrieval timestamp, and the units the file reports in. Six weeks from now you will not remember the units.
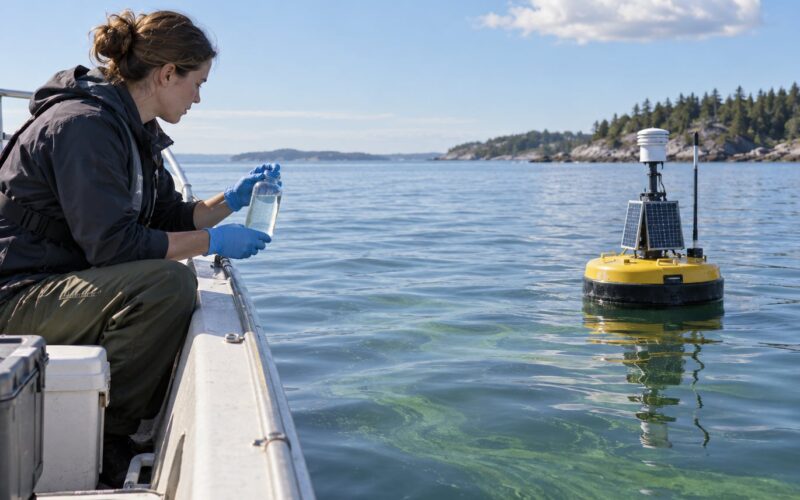
For a marine robotics or environmental sensing project specifically, also line up a reference station near your test site before the field day, not after. Knowing which NOAA station you will compare against is part of the test plan.
How to Use NOAA Data for a Project: Step-by-Step
How to use NOAA data for a project by defining the question
Start with a question narrow enough to fail. “Ocean data” is not a question; “where does water temperature drop fastest along my robot’s planned transect in September” is. The narrow version tells you which variable you need, which depth range counts, and how often you need to sample.
For a sailing robot project, the useful version is usually spatial and temporal at once: a set of lat/lon cells, a date range, and a variable like sea surface temperature. That phrasing maps directly onto almost every NOAA query interface, which saves you an afternoon of translating your idea into someone else’s parameter names.
Write the question down in one sentence, with the variable, the place, and the period. If you cannot fill in all three, you are not ready to pick a dataset yet.
Find the right NOAA dataset
Pick the archive by variable first, not by area. Sea surface temperature from a satellite product and sea surface temperature from a buoy are different datasets with different error characteristics, and only one of them may cover your dates.
| Archive or product | What it holds | Typical project use |
|---|---|---|
| Climate Data Online (NCEI) | GHCN-Daily and GHCN-Monthly station records, global summaries, Storm Events | Historical weather at a land station, climate normals, event analysis |
| CO-OPS | Tide predictions, verified and preliminary water level, water temperature and conductivity at stations | Water level at a coastal study site, tidal timing for a field day, datum-aware elevation |
| NDBC buoys | Moored buoy winds, air and sea temperature, wave height and period | Offshore conditions for a sail plan, wave climate, sensor cross-checks |
| ERDDAP servers | Gridded and tabular ocean and atmosphere products, many with subsetting and graphing built in | Pulling a small rectangle or date range without touching raw archive formats |
| GOES and VIIRS via NESDIS | Satellite imagery and derived products, including sea surface temperature | Covering a study area too large for in-situ work, cloud and storm context |
| NEXRAD Level II | Radar reflectivity and velocity | Precipitation timing during a field test |
| NOAA Big Data Program | Cloud copies of large or rapidly growing datasets on AWS, Google Cloud and Azure | Bulk pulls, model output, anything where a single request would time out |
Record three things the moment you pick it: the dataset ID exactly as written, the spatial and temporal coverage, and the access date. Dataset IDs look like GHCND, GSOM or a long ERDDAP identifier, and they are the single most useful thing to paste into a search engine when something breaks later.
Inside ERDDAP specifically, the variables carry CF standard names, so you can search for water_surface_height_above_reference_datum rather than guessing at a station-specific field. That is the difference between two minutes of searching and two hours.
Download the data in a usable format
Choose a route based on volume, not preference. The web interfaces are genuinely good for a one-off; they are hopeless for a repeatable scripted pull, which is exactly the complaint people post about scraping the Climate Data Online form.
| Route | Auth needed | Best for | Watch out for |
|---|---|---|---|
| Climate Data Online web interface | None for a manual export | One station, one variable, a quick CSV | Not repeatable; no version history of your query |
| Weather and Climate Toolkit | None | Climatology, station maps, quick visual checks | Same limits: it is a browsing tool |
| NCEI access services API | Free token via email | Scripted pulls, thousands of rows, JSON or CSV | Dataset ID and station ID must both be exact |
| ERDDAP | None | Constrained subsets, ocean data, netCDF and CSV, built-in plots | A “dataset not found” error usually means a stale or wrong ID |
| Direct archive files | None | Bulk historical pulls, fixed-format files | You get everything in the file, not just your subset |
| Cloud copies via the Big Data Program | Cloud account credentials | Very large files, model output, near-real-time feeds | Awkward for a tiny one-variable request |
Two habits prevent most download failures. First, request a deliberately small test subset: one station, one week. If that comes back clean, widen the range. Second, expect partial failure when you request many stations. It is normal for stations inside your bounding box to return nothing for your date range because they were not reporting then, so wrap the request so one empty station does not kill the run.
Paste the request URL into a browser before you paste it into code. If the page renders rows, your parameters are right and any error is in your parsing, not your query.
Clean and interpret the data
Raw NOAA files are tidy, not clean. Four things will trip you up.
- Missing-value sentinels. Values of 9999, -9999 or 999.0 are not readings. They will silently wreck an average if you leave them in. Replace them with null before any math.
- Units. GHCN-Daily stores precipitation in tenths of millimeters, temperature in tenths of degrees Celsius, and wind in tenths of meters per second. Divide before you plot, or your chart will be off by a factor of ten and look plausible, which is worse than looking broken.
- Timestamps and time zones. Most archives report in UTC. Local station observations and your own robot logs are usually local time. Convert once, at ingest, and store both.
- Quality control and verification status. GHCN-Daily rows carry flags for failed, missing and suspect checks, and recent data is preliminary until a human verifies it. Coastal water level arrives as both preliminary and verified products, and they will differ. Do not publish the preliminary series as final.
Also deduplicate on station, timestamp and variable before joining anything. Retried requests and overlapping files produce duplicate rows that quietly bias a trend line.
Interpret with the coverage in mind. A buoy that reports every ten minutes through a calm week and then goes dark for a month tells you about the week, not the month. Plot your data gaps before you plot your data.
Combine NOAA data with project measurements
This is where marine work gets its value. NOAA gives you an authoritative, independent reference; your own sensors give you detail the archive does not resolve. Align them on a common time base first, then on position.
For a field robot, resample your onboard log to the NOAA record’s cadence rather than the other way around, and keep the original high-rate data intact. Interpolation fills gaps; it does not create measurements, so flag anything you interpolated rather than passing it off as observed.
Carry the uncertainty through. A satellite sea surface temperature skin measurement and a thermistor 50 centimeters below the surface are both valid, and they will disagree for real physical reasons. Say so in the analysis instead of averaging them into one number and hoping.
Keep attribution attached to every derived file: source dataset, dataset ID, request parameters and retrieval timestamp, carried as columns or a sidecar note. Six weeks later, regenerating the figure depends on it.
Visualize and validate the results
Plots are the validation step, not decoration. A map with your stations and your study area overlaid catches an entire class of silent errors, and it is the fastest check there is.
Use four views: a station or track map, a time series with gaps visible, a scatter or difference plot between your sensor and the NOAA reference, and a coverage histogram showing how many records you actually have per day. If a day has no bar, you had no data that day, and your analysis should reflect it.
Then check the numbers against reality. Does the tidal cycle in your water level series match the predicted tide times for that station? Do your seasonal temperatures line up with the nearest land station’s record? Do units survive the round trip? Sanity checks like these take minutes and catch most remaining problems.
If you built the figure from a script, keep the script next to the figure. A chart you cannot regenerate is a claim you cannot defend.
Document, update, and use the data responsibly
NOAA data produced by the US government is generally public domain, which means you can publish and reuse it. Credit is still expected and still good practice, and it costs you one sentence: name NOAA, name the specific product, and give the retrieval date. Something like “Water level from NOAA CO-OPS station 9414290, verified product, retrieved 3 October 2026” is a complete, honest citation.
Versioning matters more than most people expect. Keep the retrieval timestamp with the file, and record the dataset version where one is published. Near-real-time products get corrected, so a script that re-downloads without pinning will quietly produce different numbers on its next run.
Check each product’s update schedule before you build a pipeline on it. Buoys report on their own cadence, some coastal products update hourly, verified water level lags behind preliminary, and satellite products have their own reprocessing cycles. Know your latency before you promise anyone a live dashboard.
Finally, state the limits in your write-up. Sparse coverage, station relocations, datum changes, the age of a buoy’s last calibration, the difference between a satellite skin temperature and an in-water reading. A sentence on limitations reads as competence, and it protects you when a reviewer asks the question you hoped nobody would.
Common Mistakes
These are the errors that show up again and again, in forum threads and in my own first passes.
- Treating forecast data as observed data. Model output and measurements are different products with different meanings. Use observations for what happened; use forecasts for what was predicted, and label them separately.
- Ignoring units. The tenths convention in GHCN-Daily and the millibars-versus-hectopascals question in pressure data are the two that catch nearly everybody. Convert once, at ingest, and assert the units in code.
- Leaving missing values in as numbers. A 9999 sentinel inside an average is a fabricated low temperature. Null them first.
- Mixing time zones. UTC archives against local field logs produce a plot that looks plausible and is shifted by hours. Convert at ingest and store both.
- Failing to cite the dataset. Dataset ID, station ID, product type and retrieval date. Four items, one line.
- Expecting every station in a bounding box to have data. Many will not, for your dates. Handle empty responses instead of treating them as an error.
- Copying a stale dataset ID. A “dataset not found” error on ERDDAP is usually an outdated identifier, not a server problem. Search the server’s dataset list for the current one.
- Requesting global files when you need one county. Subset first. A large download that gets abandoned is the most common way people conclude NOAA data is “hard to use.”
- Publishing preliminary data as final. Verification and QC happen after the fact. Note the status, and refresh before you submit.
- Paying for what NOAA gives away free. Geocoders and mapping keys are the usual culprits, and the well-known tutorial approach that leans on two paid third-party APIs is entirely avoidable for this workflow.
Two habits cover most of the list: start every project with a small test subset, and keep a running log of requests. The first keeps failures cheap. The second makes your work reproducible when a reviewer asks where a number came from.
Frequently Asked Questions
Is NOAA data free?
Yes. Data produced by the US government is generally public domain, and NOAA’s Climate Data Online, CO-OPS, NDBC and ERDDAP servers are free to use without payment. A few access services need a free token, which you get by entering an email address. The costs that show up in tutorials are third-party geocoding and mapping keys, not NOAA itself.
Does NOAA have a free API?
Several. NCEI publishes documented access services that return JSON or CSV and need a free email-based token. ERDDAP servers expose a REST-style interface with no authentication at all, plus built-in subsetting, graphing and export to netCDF. CO-OPS and NDBC also offer direct data endpoints. For scripted work, these replace scraping the web interface entirely.
Can Excel pull weather data?
Yes, for a one-off. You can paste a Climate Data Online export into a sheet, or use Power Query’s Web.Contents function against an ERDDAP or API URL that returns CSV, then parse it as a table. Excel is a fine way to explore a single station and variable, and a poor way to repeat the pull weekly, because there is no version history and no error handling.
What is the NOAA database?
There is no single NOAA database. NOAA runs several data centers that each archive a different observing system: NCEI for climate and weather records, CO-OPS for coastal water level, NDBC for buoys, and NESDIS for satellite observations. Each has its own portal, formats and quality flags, which is why finding data means knowing which variable you need before which portal you visit.
What data does NOAA have for climate change?
The core record is GHCN-Daily, a long station-level series of daily observations maintained through NCEI, plus gridded products and published climate normals based on 30-year reference periods. For ocean context, CO-OPS water level and satellite sea surface temperature add the marine side. Any trend claim should name the dataset, the reference period, and whether the values are verified.
How far back does NOAA data go?
Coverage varies by product. Land station records extend well into the 1800s for a handful of long-running sites, with GHCN-Daily commonly reaching back around 1901 for broad station coverage. Tide gauge records at major ports run over a century. Buoy and satellite products are much younger, and many modern buoys date from the 1990s onward, so check the specific station’s period before promising a time span.
Conclusion
The workflow is short enough to memorize: one precise question, one matching dataset, one small test subset, then quality checks and citation before analysis. Pick the archive by variable rather than by area, find your station IDs before you request anything, and treat missing values, units, time zones and verification status as part of the dataset rather than a cleanup step at the end.
Start with the smallest version of your project: one station, one variable, one week. If that pull is clean, the full project is mostly repetition.