Chlorophyll sensors work by shining light of a known wavelength at a sample and measuring what comes back. The pigment absorbs the excitation light, then re-emits part of that energy as red and near-infrared fluorescence, and a photodiode or spectrometer turns the returning light into a concentration value. If you are fitting a probe to a robot hull, understanding how chlorophyll sensors work tells you more than any spec sheet.
Most people meet a chlorophyll instrument in one of two very different settings: a handheld meter clamped onto a plant leaf, or a submerged probe logging a bay for months. The optics underneath are related, but the plumbing is not. This guide covers the mechanism, the four families of instrument, calibration, placement and what a reading does and does not tell you.
Table of Contents
- What Does a Chlorophyll Sensor Measure?
- How Chlorophyll Sensors Work
- What Are the Main Chlorophyll Sensor Types?
- How Are Chlorophyll Sensors Calibrated?
- Where Should a Marine Robot Place the Sensor?
- How Do You Interpret Chlorophyll Sensor Readings?
- What Accuracy Can You Expect?
- Frequently Asked Questions
- Are chlorophyll sensors and algae sensors the same thing?
- How often should a chlorophyll sensor be calibrated?
- Can a chlorophyll sensor work in both freshwater and seawater?
- Why does a chlorophyll reading change when the water becomes cloudy?
- What is the best chlorophyll sensor for a marine robot?
- Does a high chlorophyll reading always mean a harmful algal bloom?
- Conclusion
What Does a Chlorophyll Sensor Measure?
Chlorophyll is the green pigment at the centre of every photosynthetic reaction, and its concentration is used as a stand-in for photosynthetic biomass. A sensor does not weigh the pigment. It measures a light interaction that scales with pigment concentration and then applies a calibration curve to turn that into a number.
Chemically, chlorophyll comes in closely related forms. Chlorophyll-a is the universal pigment, present in cyanobacteria, diatoms, dinoflagellates and every plant. Chlorophyll-b sits alongside it in green plants and green algae but is absent from cyanobacteria, which is why a freshwater bloom dominated by cyanobacteria can read high on an a-channel and low on a b-channel. The phycobiliproteins, phycocyanin and phycoerythrin, are separate water-soluble pigments used by cyanobacteria and red algae instead of much chlorophyll-b, and several instruments offer a dedicated phycocyanin channel for exactly that reason.
Here is the boundary worth being blunt about. An in-water fluorescence probe almost always reports an estimate of chlorophyll-a derived from the ratio of two emission peaks, not a measurement of every photosynthetic pigment present. A reflectance meter clamped on a leaf reports a relative index in arbitrary units, and its number is meaningless off that instrument. A spectrophotometer reading an acetone extract reports a real mass concentration, but it destroys the sample.
None of these identify species. If you need to know which organism is blooming, you need a pigment panel, a microscopy count or a molecular assay on top of the optical reading.
How Chlorophyll Sensors Work
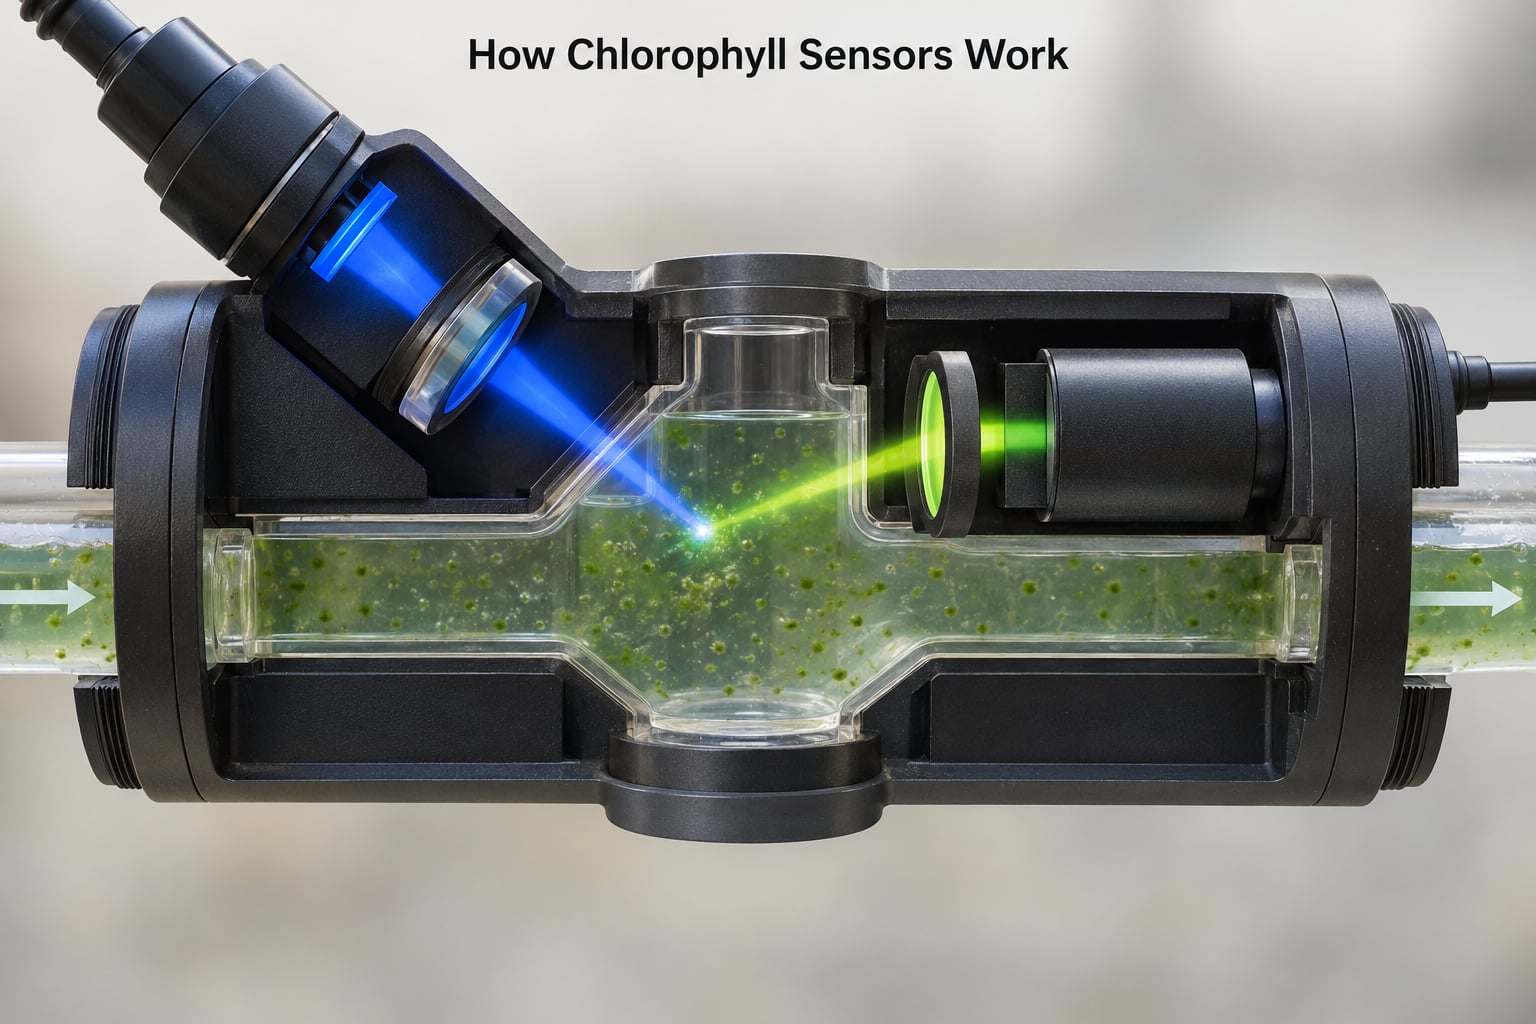
The short version: excite a sample at a fixed wavelength, filter the light that comes back down a different path, detect it, and convert the intensity into concentration. The chain has six links, and every one of them can be the reason your data looks wrong.
- Excitation. A red LED array around 620-680 nm, or a blue source near 450 nm, pushes photons into the sample. Blue is absorbed more strongly, red penetrates turbid water better, which is why water probes tend to be red and leaf meters tend to be blue and red.
- Optical path. The light travels through a fixed-length flow-through cell or bounces off a leaf or scatters in a sample volume. Path length matters because attenuation follows Beer-Lambert behaviour, so a 1 cm and a 5 cm cell reading the same water will not report the same raw signal.
- Fluorescence and scattering. Chlorophyll molecules in an excited state lose energy and re-emit it as light peaking near 685 nm and 735 nm, inside a 650-800 nm band that the oceanographic literature has mapped for decades.
- Spectral filtering. Interference filters in front of the detector pass the emission band and reject the much stronger back-scattered excitation light. Without this step the sensor would mostly measure its own lamp.
- Detection. A photodiode or photomultiplier converts photons into current, and a transimpedance amplifier turns that into a voltage the electronics can read.
- Conversion. Firmware subtracts a dark reference, applies temperature compensation, and converts the corrected ratio or intensity into a concentration using a calibration curve.
Many instruments modulate the excitation light and detect only the component that oscillates at the same frequency. That lock-in style measurement rejects ambient daylight and stray electrical noise, which is the single cheapest way to keep a probe working through a bright tropical noon.
What Happens Inside an Optical Sensor?
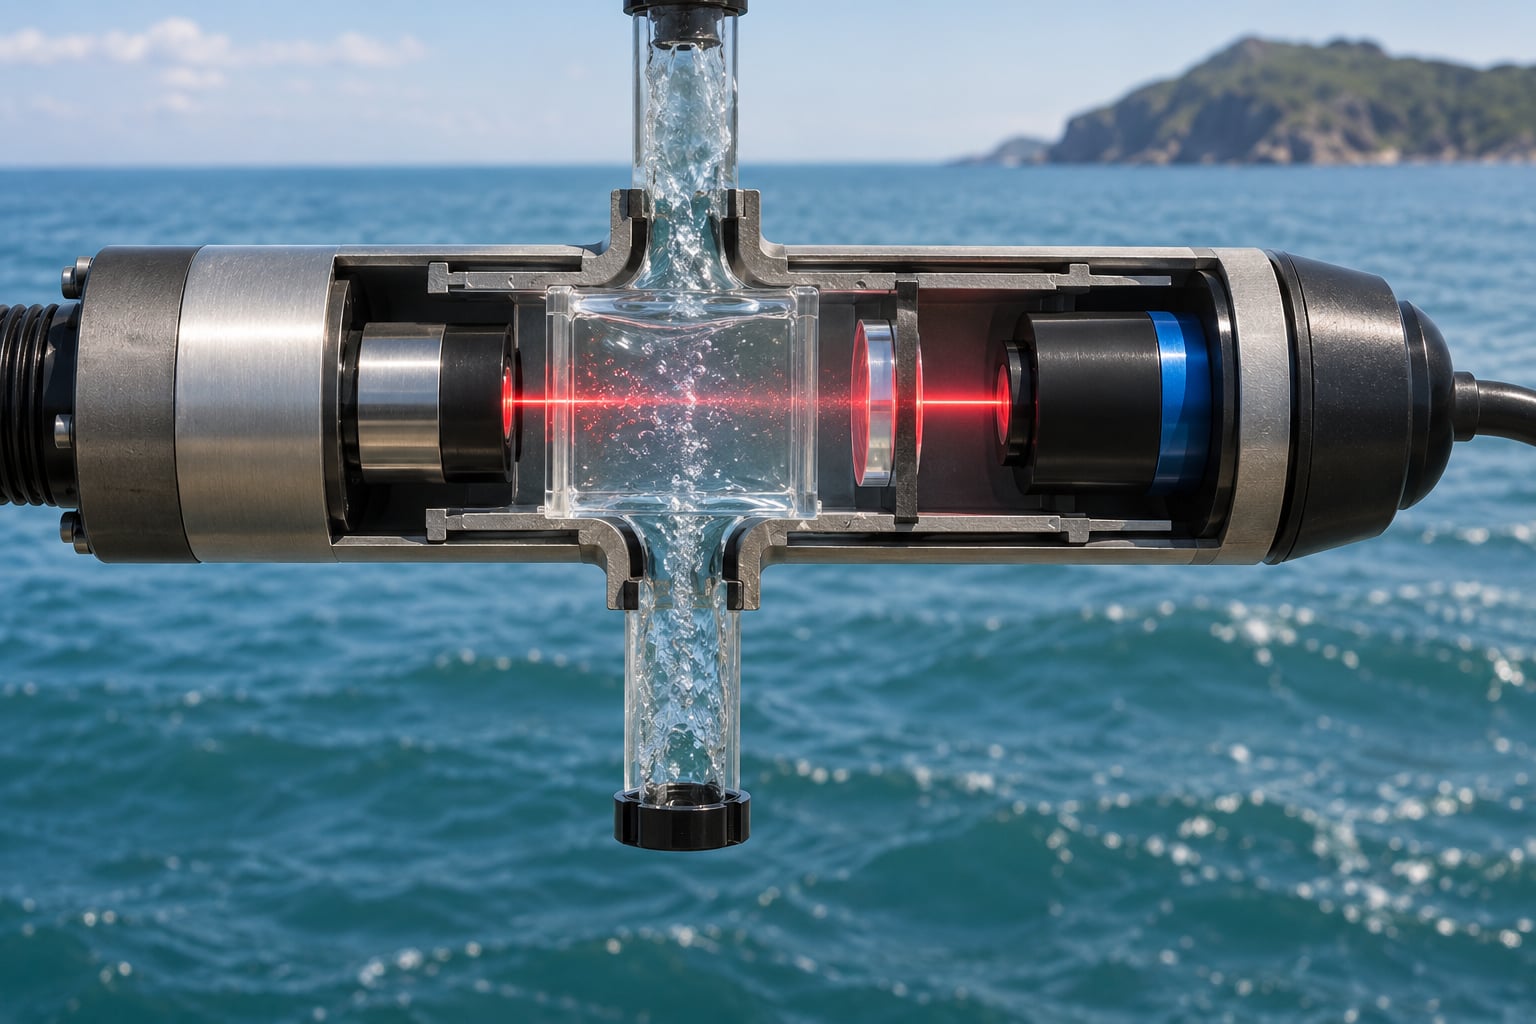
A submersible probe is a small plumbing system with an optical bench at the bottom of it. Seawater is drawn through an intake, passes a bubble trap, and flows across the optical window at a controlled rate. Light from the LED is aimed into that window, and the returning fluorescence exits through a filter set angled to keep it away from the direct excitation beam.
The detector integrates the signal over a set window, subtracts a dark count taken with the lamp off, and stores a raw value. The microcontroller then applies the calibration, applies temperature correction from an internal thermistor, and pushes the result out over a 4-20 mA loop, RS-485 with MODBUS, SDI-12 or a plain digital line depending on the model.
A reference channel, often a second detector watching a different part of the spectrum or monitoring the lamp output, lets the firmware notice when the source has drifted. Internal referencing is what separates a probe that can stay out for a season from one that needs a technician every fortnight.
What Are the Main Chlorophyll Sensor Types?
Four families cover almost everything you will meet. They differ less in the physics than in what they physically touch.
| Type | Principle | Typical use | Strengths | Limitations | Fit for a marine robot |
|---|---|---|---|---|---|
| Fluorometric probe | Active fluorescence at 685 and 735 nm after red or blue excitation | Buoys, aquaculture cages, in-line plant monitoring | Continuous, non-destructive, low power | Fouling, ambient light, quenching, no species ID | Best default choice for a wet platform |
| Reflectance or SPAD leaf meter | Absorbance and transmittance of red and near-infrared through a leaf | Crop nitrogen status, greenhouse trials | Cheap, instant, no consumables | Relative units only, needs direct leaf contact | Poor fit unless the robot is servicing a farm |
| Absorption spectrophotometer | Beer-Lambert absorbance of an extract or in-water UV-VIS | Laboratory reference, regulatory methods | Traceable mass concentration | Destroys the sample, reagents, skilled technique | Use as the reference the robot is checked against |
| Electronic proxy sensor | Optical turbidity or electrochemical response correlated with algal load | Cheap screening, drinking water networks | Inexpensive, rugged, easy to multiplex | Reports turbidity, not pigment | Useful sanity check, not a chlorophyll measurement |
The wording matters when you compare readings. A fluorometric probe gives you micrograms per litre, a spectrophotometer gives you micrograms per litre on a different calibration basis, and a SPAD meter gives you an index with no unit at all. Plots and papers that put those three on one axis are not making a real comparison.
The wavelength choices behind all of it are worth keeping in your head:
| Role | Typical wavelength | What it tells you |
|---|---|---|
| Excitation, water probes | 620-680 nm red | Good penetration in turbid coastal water |
| Excitation, leaf and dense algal probes | Around 450 nm blue | Strongly absorbed by chlorophyll |
| Emission peak, chlorophyll-a | About 685 nm | Rises roughly with pigment concentration |
| Emission peak, reference | About 735 nm | Less sensitive to concentration, used as the ratio denominator |
| Emission band, full | 650-800 nm | Where in-water chlorophyll fluorescence lives |
That 685 over 735 ratio is the quiet hero of in-water sensing. Raw fluorescence intensity alone rises and falls with lamp output, detector gain, turbidity and light attenuation, so a reading can double without the water changing. The ratio cancels most of those terms, which is why concentration estimates built on it survive field conditions better than single-channel intensity readings.
How Are Chlorophyll Sensors Calibrated?
Calibration is where chlorophyll measurements are won or lost. A probe shipped with a factory curve is only a starting point, and the curve belongs to a specific pigment, solvent and path length.
Three layers exist. Factory calibration uses a stable fluorescent reference, often a dyed material or a standard solution, to set the electronic gain and store the ratio-to-concentration curve. User calibration checks that curve against a known standard in your own matrix. Reference calibration measures actual samples by solvent extraction and spectrophotometry and fits your instrument against them, which is the only approach that produces data you can defend in a report.
The practical sequence I would follow:
- Collect a set of real samples spanning the range you expect, from clear water to the densest bloom you care about.
- Measure each one by extraction spectrophotometry to get true concentrations.
- Measure each one on the probe, keeping temperature, flow rate and integration time identical across the set.
- Fit the relationship and check the residuals. A curved residual pattern usually means the lamp, the flow or the path length is drifting between samples.
- Re-verify with one or two check samples that were not part of the fit.
Two effects will drag a calibration off without warning. Temperature shifts both the fluorescence yield and the electronics, which is why probes with a thermistor exist. Biofouling changes the optical window, which attenuates the excitation and emission together and can leave the ratio almost untouched while the raw signal falls steadily, so a ratio-based instrument fails slowly and quietly.
Check the zero in clean filtered water regularly, and log a check reading against a fixed reference each time you service the sensor. Drift of a few percent per deployment is normal; drift you never measured is not.
Where Should a Marine Robot Place the Sensor?
Placement decides whether the number means anything. The instrument measures a few millilitres in a specific geometry, and the ocean is not homogeneous.
Put the intake where the water the robot is sampling actually is. A probe on the bow reading ahead of the wake is a different measurement from one in a pumped loop drawing from a tank. Through-flow probes need a controlled flow rate, because too little flow starves the optical cell and too much shifts the pressure and the bubble fraction. If you can flush a fixed volume, do, and log the flow rate with every reading.
Keep the optical window out of direct sunlight and out of the shadow of the hull. A sunlit window saturates the detector; a shaded one under-reports. Turbulence matters more than most people expect, since entrained air bubbles scatter light like a mirror and drive a spike through the raw signal.
Depth control comes down to what you are trying to learn. A surface-following AUV profiling chlorophyll tracks the productive layer. A hull-mounted probe on a surface vessel gives you a time series at one depth and misses the vertical structure that makes bloom forecasting possible.
Fouling is the normal failure mode in seawater. Biofilm, barnacle larvae and mucus accumulate on the window within days to weeks depending on site, temperature and depth. Mechanical wipers help, so does a copper or biocide surface, and so does a sacrificial blank reference window used to detect the change. Whatever you do, log the time since last cleaning. An uncleaned series is still useful data if you label it, and misleading if you do not.
How Do You Interpret Chlorophyll Sensor Readings?
Read the units first. Raw fluorescence, sometimes given as relative fluorescence units, is a detector output with no concentration meaning. Only after the calibration curve has been applied do you have a concentration, and only then is it comparable to a reference method.
Every series has a floor and a ceiling. Below the detection limit, values are noise and should be reported as such rather than as very low concentrations. Near saturation, a high-concentration bloom compresses the signal and the instrument under-reports exactly when you most need a number, so record whether the detector is clipping.
Turbidity is the biggest routine confound. Suspended sediment scatters the excitation light and raises the background, and coloured dissolved organic matter absorbs in the same part of the spectrum. Clear-water calibration in turbid water can over-read, and conversely a probe in clear water can under-read. Logging a simultaneous turbidity channel lets you flag the affected samples instead of quietly averaging them in.
Detector aging shifts sensitivity slowly. So does species composition, since different algae fluoresce with different quantum yields, so a population change can move your chlorophyll-a estimate without any change in total pigment. Treat large step changes as something to check, not as a bloom, until a bottle sample confirms it.
What Accuracy Can You Expect?
Accuracy is set by the method, not the datasheet. Extraction spectrophotometry remains the reference most regulatory work is written against, and a good laboratory implementation will report repeatability within a few percent. A hand-built LED and photodiode probe on the same sample will not match that, and expecting it to is how people end up with confident nonsense.
In process water and aquaculture cages, a commercial fluorescence probe typically tracks reference samples closely when it is clean, freshly calibrated and in a narrow concentration band. In coastal water, where salinity, turbidity and species vary, expect wider scatter, often 20-30 percent between an uncalibrated probe and extraction, narrowing if you build a site-specific curve. In open ocean, agreement is generally worse still.
Cross-brand comparison is limited because each manufacturer fits a different curve to its own optics and pigment assumptions, and two instruments that both read micrograms per litre can still disagree by a wide margin. Report the instrument, the calibration, the temperature, the flow rate and the cleaning date with every dataset. An honest uncertainty range is worth more than a precise number you cannot defend.
Frequently Asked Questions
Are chlorophyll sensors and algae sensors the same thing?
Not quite. A chlorophyll sensor targets a specific pigment and reports a calibrated estimate of it. An algae sensor is usually a broader term covering anything that responds to algal load, sometimes a raw fluorescence channel, sometimes a turbidity-based proxy. Marketing pages use both words loosely, so check whether the datasheet names a pigment, a channel and a calibration method before assuming the two are interchangeable.
How often should a chlorophyll sensor be calibrated?
Check it before and after every deployment, and do a full check at least monthly in a moored or caged position. In shallow, warm, biologically active water, weekly verification is more realistic, and fouling can force daily checks. A clean filtered-water zero and one stable reference reading are enough for routine verification. A full multi-point recalibration against extraction samples belongs on a seasonal or event-driven schedule.
Can a chlorophyll sensor work in both freshwater and seawater?
The optics work in both, but the calibration does not transfer. Salinity, temperature and pH all shift fluorescence behaviour, and the pigment mix in freshwater is usually dominated by green algae with substantial chlorophyll-b while marine blooms are often diatoms or dinoflagellates with different fluorescence yields. Treat a freshwater curve and a seawater curve as two separate calibrations, and do not assume a factory setting is valid for both.
Why does a chlorophyll reading change when the water becomes cloudy?
Suspended particles scatter both the excitation light and the emitted fluorescence, and coloured dissolved organic matter absorbs in the same spectral region. That raises the background, so an instrument calibrated in clear water tends to read high in turbid conditions. A ratio-based measurement suppresses some of this because scattering affects both channels, but it does not remove it. Logging turbidity alongside the chlorophyll channel is the practical fix.
What is the best chlorophyll sensor for a marine robot?
For a small or custom platform, an in-water fluorescence probe with a red excitation source, a flow-through or pumped cell, a dark reference and a fouling strategy suits most missions. Choose on optical window condition, whether the reference channel is internal, output interface and power draw rather than on headline range. If you build your own, expect a relative trend signal rather than defensible absolute values.
Does a high chlorophyll reading always mean a harmful algal bloom?
No. Chlorophyll measures pigment, and pigment is not the same as toxicity. A dense bloom of a harmless species can produce high values, and a toxic species can appear at concentrations below what looks alarming. Many jurisdictions set guidance thresholds around cell counts or species identity rather than pigment alone. Treat a sensor reading as an early warning that triggers a bottle sample, not as a management decision on its own.
Conclusion
Every chlorophyll sensor, from a handheld leaf meter to a buoy-mounted probe, does the same three things: it delivers light of a known wavelength, it measures the light that comes back, and it converts that measurement into a concentration through a calibration. Everything that separates a good dataset from a bad one happens in those three steps rather than in the spec sheet.
Pick the sensor family that matches what your instrument actually touches, and for a marine robot that means a fluorescence probe with a defined optical path, a dark reference and an anti-fouling plan. Build the calibration against real samples from your own water rather than trusting a factory curve, keep the window clean and log when it was last cleaned, and validate against extraction spectrophotometry before you let the vehicle act on the number autonomously. Updated for 2026, since sensor optics and output interfaces do change faster than the physics.