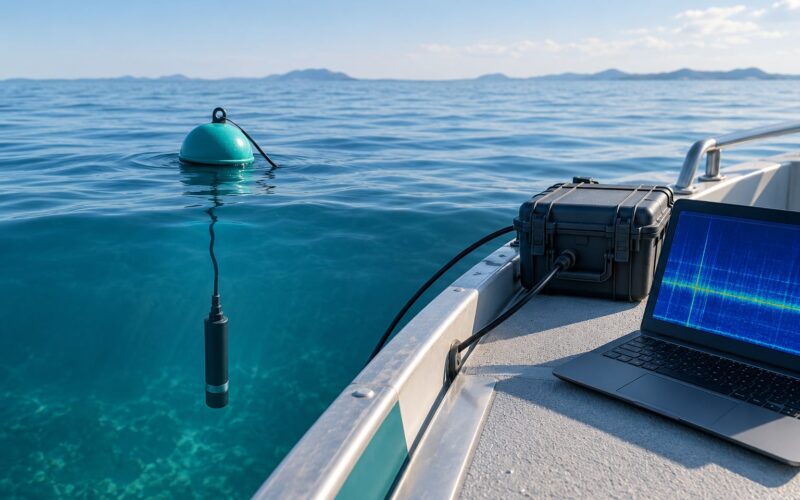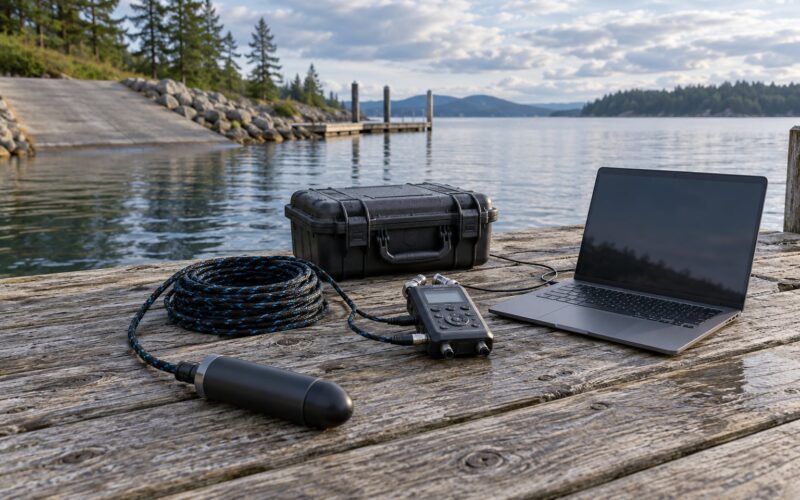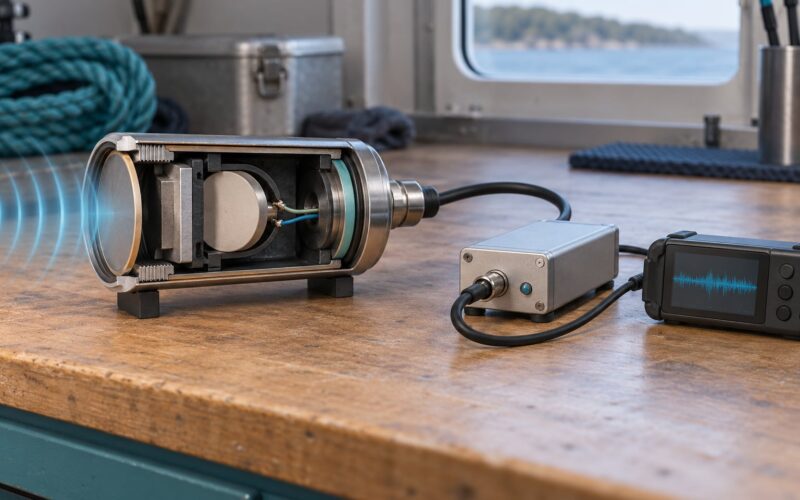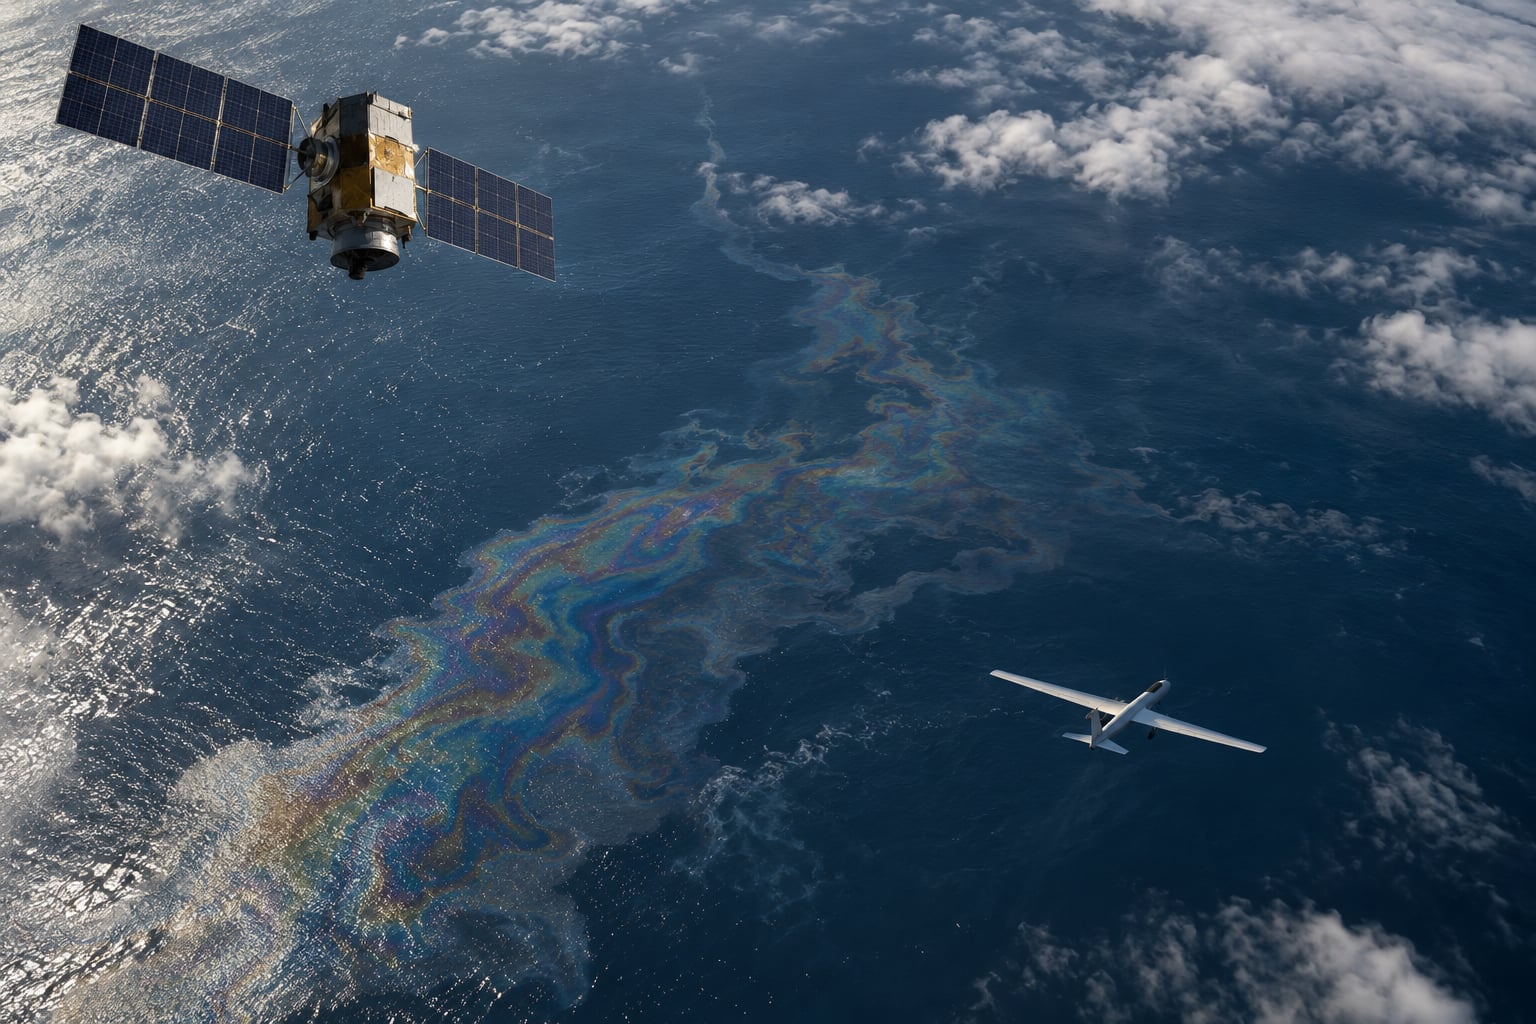
Remote sensing detects oil slicks by measuring how a spill changes the sea surface’s physical and chemical properties from a distance. Radar registers the dampened backscatter that oil produces when it flattens capillary waves, optical and thermal sensors register the altered reflectance and emissivity of the water, and fluorescence sensors register the light oil emits when a laser excites it. Every detection then goes through processing, comparison against reference data, and field confirmation before anyone treats it as a real spill.
The whole chain matters because oil spreads with wind and current, and early identification cuts ecological damage, cleanup cost and fines. Aircraft and vessels can report what they fly over, but they cannot watch an entire coastline continuously. Satellites and drones fill that gap with wide-area, 24-hour surveillance.
Table of Contents
- How Remote Sensing Detects Oil Slicks: The Core Principle
- What Makes Oil Slicks Visible to Remote Sensors?
- Which Remote Sensing Methods Detect Oil Slicks?
- How Do Satellites and Aircraft Identify an Oil Slick?
- How Reliable Are Remote Sensing Detections?
- What Are the Main Applications for Marine Monitoring?
- Frequently Asked Questions
How Remote Sensing Detects Oil Slicks: The Core Principle
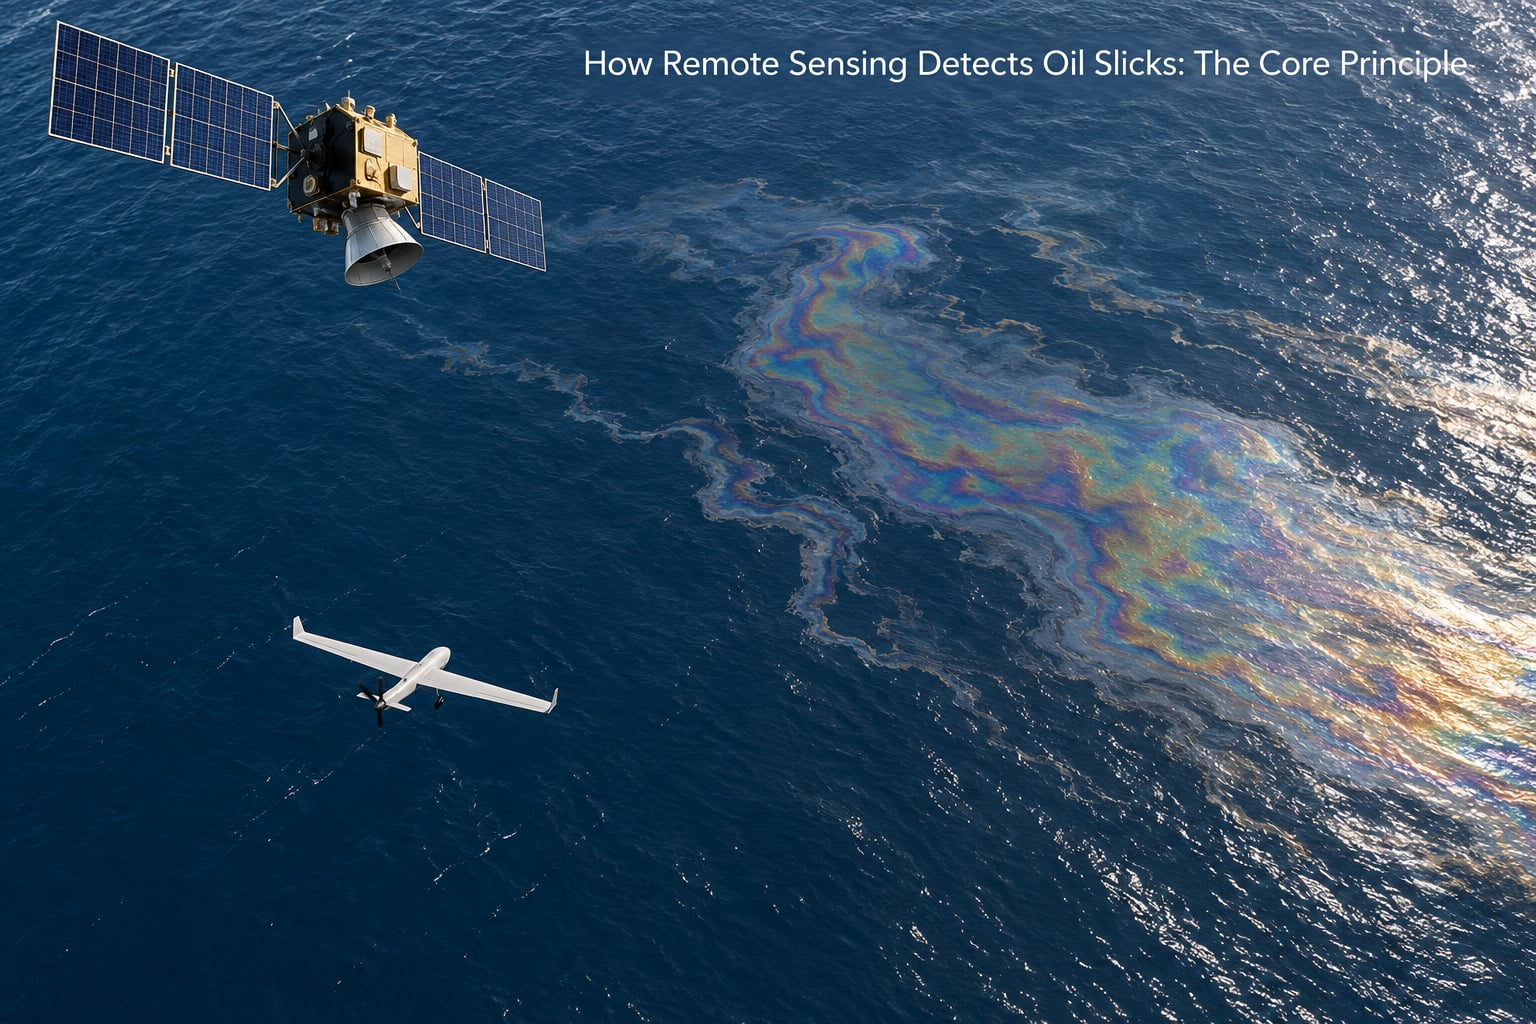
Remote sensing is simply the measurement of something from a distance instead of touching it. A satellite or an aircraft points a sensor at the sea and records the energy that comes back.
The detection chain has four steps, and each sensor type differs only in which step it dominates.
- Sense a contrast. The instrument records a difference between slick-covered water and clean water, whether that is radar backscatter, visible colour, thermal emission or fluorescence intensity.
- Calibrate and correct the measurement. Sensor noise is removed, the image is georeferenced, and atmospheric effects such as haze, sun glint and humidity are corrected so the numbers mean something physical.
- Extract features. Software looks for dark patches, spectral signatures, temperature anomalies or texture differences, and outlines them as candidate slick polygons.
- Compare and validate. Candidates are checked against wind fields, currents, known discharge points, previous imagery and, where possible, a report from a vessel, aircraft or drone before a response is launched.
What remote sensing cannot do is read the oil’s chemical composition directly. It tells you that something changed the surface, then narrows down what that something probably is.
What Makes Oil Slicks Visible to Remote Sensors?
Oil on water is visible to instruments because of how it changes surface physics, not because oil is a bright or dark object in itself.
Roughness damping
Clean water carries a fine texture of short capillary and gravity waves. A surfactant film and the viscosity of the oil suppress those waves, producing a locally smoother surface. That single change is what makes oil show up so clearly in synthetic aperture radar, or SAR, imagery.
Thickness, colour and foam
Very thin sheen is nearly transparent and barely changes the colour of water, which is exactly why visible-light sensors miss it. Thicker oil darkens the surface and forms metallic rainbow iridescence at grazing angles. Natural surfactants in the water also collect at the slick edge and generate persistent white or grey foam lines, which are often the first clue a spiller sees on the surface itself.
Temperature difference
Fresh crude and many petroleum products have a different thermal emissivity than seawater and usually cool the surface through evaporation. The result is a measurable temperature depression in thermal infrared imagery, which is why a slick often appears as a cool patch rather than a dark one.
Fluorescence
Crude oil and refined products absorb ultraviolet and blue light and re-emit it at longer wavelengths. That energy transfer is unique enough to act as a chemical fingerprint, and it is the basis of laser fluorosensors and of hyperspectral oil typing.
Conditions that hide or fake the signal
Wind between roughly 1.5 and 10 m/s is the useful window for radar work. Below that, too much of the sea looks smooth and the contrast disappears. Above it, wind roughens the surface and the oil signal is buried. Cloud blocks optical and thermal sensors but not radar, while low sun angles and rough water produce sun glint that can mimic a slick in visible imagery.
Which Remote Sensing Methods Detect Oil Slicks?
Five method families do the work, and each answers a different question. Comparing the sensors side by side is more useful than picking a single winner, because no single instrument answers every operational question.
| Method | What it measures | Works at night | Works through cloud | Thickness estimate | Oil typing | Main limitation |
|---|---|---|---|---|---|---|
| SAR (synthetic aperture radar) | Radar backscatter, a proxy for surface roughness | Yes | Yes | Very rough only | No | Dark look-alikes are common |
| Optical and multispectral | Reflected sunlight across visible, near-infrared and shortwave-infrared bands | No | No | Partly, with spectral indices | Partly, with hyperspectral | Clouds, haze and sun glint |
| Thermal infrared | Surface temperature and emissivity, roughly 8 to 14 micrometres | Yes | No | Roughly | No | Thin sheen barely cools the surface |
| Laser fluorescence and hyperspectral | Light re-emitted by oil after excitation, often 400 to 650 nanometres | No | No | Limited | Yes, best of the group | Airborne and low-flying platforms only |
| Microwave radiometry | Brightness temperature at microwave frequencies | Yes | Yes | Yes, for thick oil | No | Fails on thin sheen, needs dedicated hardware |
SAR: how remote sensing detects oil slicks without sunlight
SAR sends a microwave pulse and measures the energy scattered back. Rough open water scatters that energy in many directions and comes back bright; oil-damped water scatters less back toward the sensor and comes back dark. The result is a dark spot against a bright sea that can be read at night and through heavy cloud.
The mechanism runs through damping of capillary waves rather than absorption of the radar signal, which matters because a thick slick and a one-micron sheen can look identical. Polarization also carries information. Cross-polarized channels such as VH tend to suppress sea clutter and sharpen the slick contrast, while co-polarized VV is more sensitive to wind and is what wind-field products are built from.
Sentinel-1 from the Copernicus programme and RADARSAT-1 and RADARSAT-2 from the Canadian Space Agency made SAR oil-spill monitoring routine. Sentinel-1 delivers roughly 20 metre resolution on open water, which is adequate for a large spill but below the threshold for a small sheen.
Optical and multispectral imagery
Passive optical sensors record reflected sunlight, so they work only in daylight and only where the sky is clear. What they add is spectral detail. Ratios between bands, such as a shortwave-infrared index, separate oil from water and from coastal vegetation far better than a single visible image.
Low-resolution ocean colour instruments such as NASA MODIS and AVHRR, and MERIS before it, cover the whole globe daily at the cost of resolution. They are excellent for spotting where something has changed and useless for sizing a small slick. High-resolution commercial imagery such as QuickBird or WorldView-class satellites gives sharp local views but narrow coverage and revisit gaps.
Thermal infrared
Thermal sensors measure emitted surface radiance in the 8 to 14 micrometre window and convert it to temperature. Because evaporating oil cools the surface, a slick appears as a cool anomaly against warmer water. Thermal data works at night, which is useful for platform and pipeline monitoring, but it is blocked by cloud and it under-detects very thin films that barely alter the surface energy balance.
Laser fluorescence and hyperspectral sensing
A laser fluorosensor flies low over the surface, fires an excimer laser in the ultraviolet or blue, and records the wavelength and strength of the light that comes back. Oil re-emits across a characteristic band, and the spectrum separates crude from diesel from heavy fuel oil. It is the only routine method that identifies oil type directly.
Hyperspectral sensors extend the same idea passively, recording dozens of narrow bands that produce a spectral signature for each surface type. From aircraft or drones this identifies oil type and, to some extent, separates thick oil from emulsions. Oil fingerprinting is the part of this field that most deserves more attention, and it is still limited to the platforms that fly low enough to collect clean spectra.
Microwave radiometry for thickness estimates
Oil is far more electrically transparent than seawater at certain microwave frequencies, so a film lets more energy from below pass through to a receiver. A radiometer measures brightness temperature, which shifts in proportion to the volume of oil between the sensor and the water beneath it. That makes microwave radiometry one of the few remote techniques that estimates thickness directly rather than inferring it from brightness.
The honest limitation is that the sensitivity suits oil roughly a millimetre thick and thicker. A sheen of a few microns is below what these instruments can resolve, and small spills are exactly the ones crews most want quantified.
How Do Satellites and Aircraft Identify an Oil Slick?
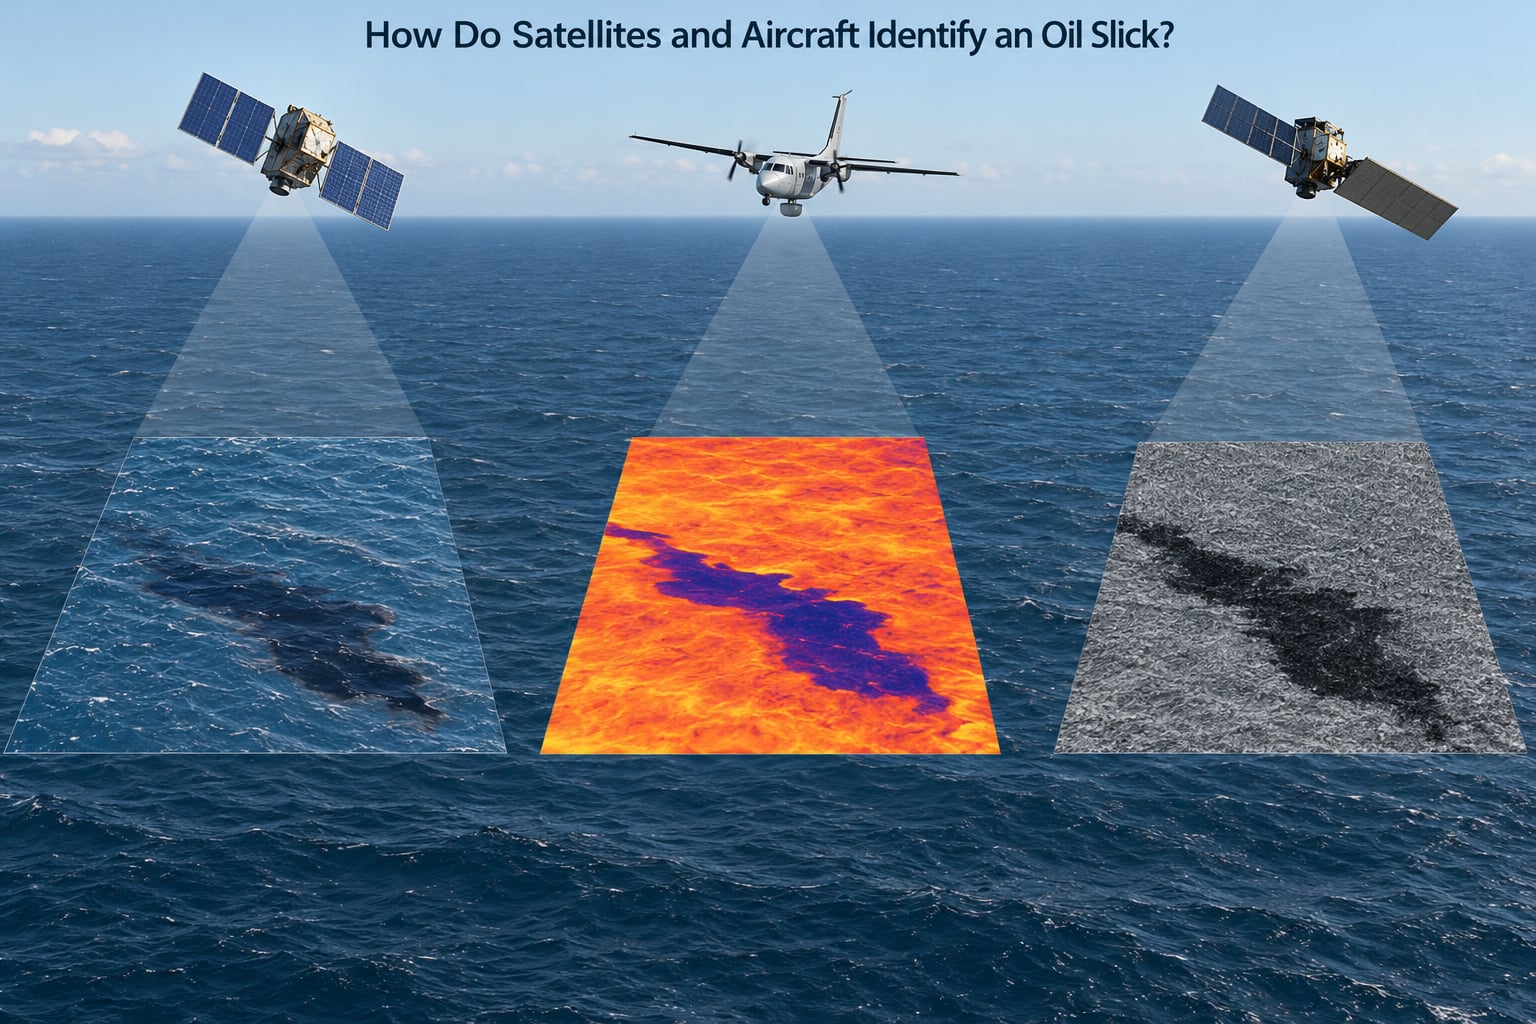
The operational workflow is more procedural than the physics, and practitioners complain about it most. A rough seven-step version looks like this.
- Acquire the scene. Order the latest SAR acquisition covering the area, usually with both polarizations, and pull any optical or thermal image acquired within the same hour if conditions allow.
- Pre-process. Apply orbit correction, thermal noise removal, border noise removal and radiometric calibration, then produce a backscatter image in decibels.
- Pull the wind field. Get the same-day wind speed and direction for the scene. This is the single most important step, because without it a dark spot has no meaning.
- Detect dark features. Threshold backscatter below the local sea background and run connected-component or segmentation analysis to produce candidate polygons. Modern pipelines use convolutional networks such as U-Net or DeepLabv3+ trained on datasets like GlobalOSD-SAR or LADOS instead of fixed thresholds.
- Mask the look-alikes. Remove or flag low-wind areas, algal blooms, current fronts, internal waves, rain cells, kelp beds, fixed installations and sea ice, using GIS layers rather than pixel values alone.
- Cross-check with context. Compare with previous imagery, forecast currents and winds, modelled trajectories, and any reported discharge point. A candidate drifting down-current from a known outfall is a very different event from one appearing offshore.
- Confirm and publish. Dispatch a vessel, aircraft or drone for visual confirmation, then hand the validated slick polygon to the response coordination system.
Most operational pipelines converge on this same shape, with one emphasis that never varies: mask wind and fixed geographic features before you classify anything.
How Reliable Are Remote Sensing Detections?
Reliable enough to trigger a response, not reliable enough to skip confirmation. Any honest account of the limits starts with look-alikes.
- Low-wind zones. Naturally smooth water produces exactly the dark patch oil produces, and it moves with the wind field just as oil does.
- Algal blooms. Blooms suppress waves in places and change optical colour in others, so they can mimic oil in both radar and optical imagery.
- Internal waves and current fronts. These produce long linear dark features that mimic slick edges.
- Rain. Downdrafts damp capillary waves over a circular area and generate textbook radar look-alikes.
- Sea ice and kelp. Both give strong radar backscatter variation that complicates classification in coastal and polar waters.
- Sun glint. In optical imagery, specular reflection off a wavy surface can look remarkably like an iridescent sheen.
False negatives come from the other direction. Spills below the detection threshold of the available resolution, oil hidden under cloud for the whole revisit window, or oil so emulsified that it behaves like a water-in-oil emulsion rather than a damping film will all pass by unflagged. A satellite with a six-day revisit can miss an entire short-lived release.
Weathering compounds it. Evaporation of light ends, emulsification with water, and biodegradation all change how a slick interacts with light and waves over days. Detection confidence drops as the spill ages, which is the opposite of what responders would like.
Access is a quieter constraint. High-resolution commercial SAR is fast but expensive and slow to license, while free open data such as Copernicus Sentinel-1 is free and broad but coarser. A small monitoring team often ends up building its pipeline on the free archive and paying only for the confirmation pass.
What Are the Main Applications for Marine Monitoring?
Detection is only the first half of the value. The second half is what the response does with a validated alert.
Spill response and trajectory modelling
A confirmed slick polygon feeds drift models that project where the oil will be, which is what determines whether a skimming vessel has any chance of reaching the thick part before it disperses. In Norway, NOSDRA coordinates this national response capability, and similar authorities elsewhere run on the same alert-to-asset loop.
Habitat and shoreline protection
Nearshore slicks move at different speeds than open water does, and a slick that closes on a wetland at a different rate than the surface currents suggest is a much bigger problem. Tracking the leading edge rather than the centroid gives responders time to close sensitive areas.
Pipeline, platform and shipping oversight
Thermal and SAR monitoring around offshore platforms, subsea pipelines and shipping lanes catches chronic small discharges that never generate an incident report. A pipeline leak of a few barrels a day is invisible to operational sensors but shows up clearly in a time series of thermal anomalies.
Drone confirmation and edge computing
Drones fill the gap between satellite revisit and vessel arrival. Because a small model can run on the aircraft itself, an onboard U-Net can flag a slick and stream coordinates back without a satellite downlink round trip. That is the pattern behind lightweight segmentation models on UAVs, and it is what turns detection into a same-hour confirmation.
Long-term observation and research sampling
Individual incidents are only part of the record. Archived imagery compiled into time series reveals chronic sources, natural seeps versus human discharges, and how much oil reaches the water column each year. Research vessels use slicks as sampling cues: a thermal anomaly tells them where to drop a CTD and take a water sample, which is far more efficient than sampling on a grid.
Free data sources to start with
You do not need a contract to begin. The Copernicus Open Access Hub provides Sentinel-1 SAR globally without charge. NOAA and EMSA CleanSeaNet publish spill detection products and reported incident layers, and UN-SPIDER keeps a reference matrix of which sensor suits which phase of a spill. Those three get a new analyst most of the way to a working pipeline.
Frequently Asked Questions
Why is SAR good at oil spill detection?
Radar measures surface roughness, and oil suppresses the short capillary waves that make open water scatter energy back toward the sensor. Oil-covered water therefore returns less energy and appears as a dark patch against a bright sea. Because radar transmits its own signal, it works at night and through cloud, which no optical or thermal sensor can do.
Can satellites detect oil spills through clouds?
Radar can. Synthetic aperture radar sends microwave pulses that pass through cloud and most precipitation, so a spill stays visible in Sentinel-1 or RADARSAT imagery during bad weather. Optical and thermal infrared sensors cannot, since cloud blocks the sunlight or the emitted heat they rely on. In practice, teams alternate between radar for detection and optical or thermal data for confirmation.
How small an oil spill can a satellite actually detect?
It depends on the sensor and the conditions. Sentinel-1 offers roughly 20 metre resolution on open water, which suits a spill of several square kilometres but not a thin sheen. Detection also fails below about 1.5 m/s wind, where the sea is naturally smooth and oil cannot be told apart from it, and above about 10 m/s, where wind roughens the surface and buries the signal.
Which sensor should a small monitoring team choose first?
Start with Sentinel-1 SAR from the Copernicus programme, because it is free, global, needs no licence negotiation and works through cloud and at night. Pair it with a wind field from the same acquisition, since look-alike rejection depends on it. Add optical or thermal data for confirmation when the sky is clear, and only then consider paying for commercial high-resolution SAR.
How do you confirm an oil slick seen from orbit?
Dispatch something that can see it at human scale: a response vessel, a fixed-wing aircraft or a drone carrying a camera or fluorosensor. Oil slick remote sensing narrows the search, but field observation is what converts a dark polygon into a confirmed incident, a spill thickness estimate and a defensible record for the response log.
Start with Sentinel-1 and a wind field. Everything else in this field, the thermal pass, the fluorescence survey, the paid high-resolution radar, the drone confirmation, builds on top of those two.