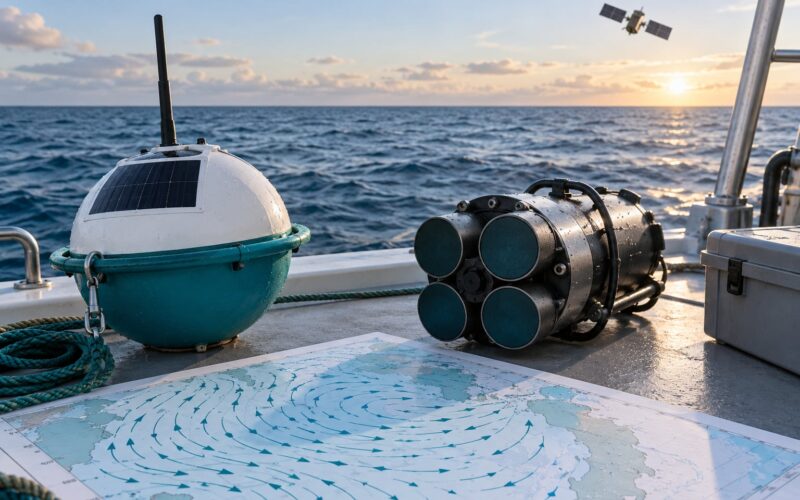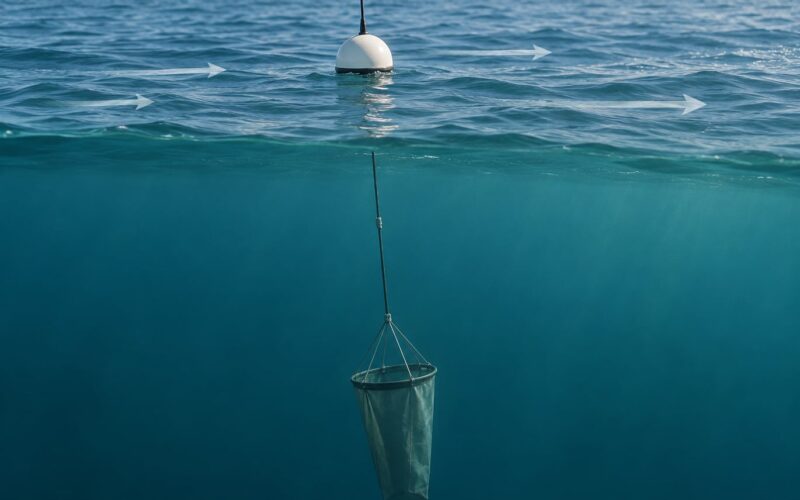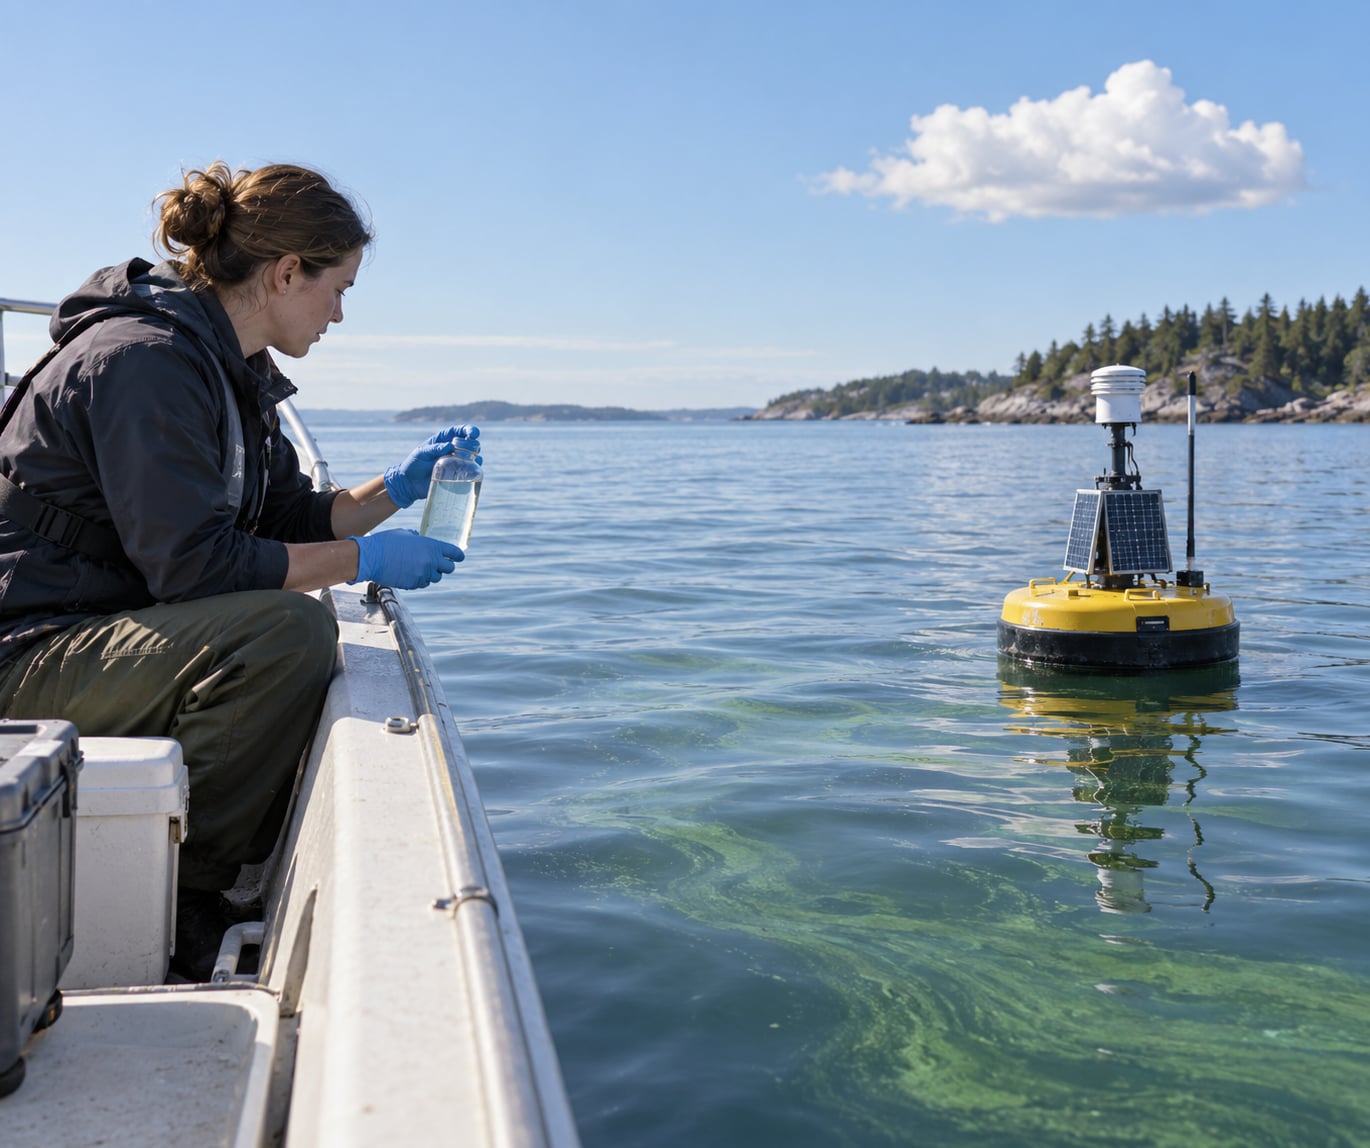
Algae blooms are detected by reading three separate signals: the water’s color, the fluorescence its pigments give off, and the biological material you can pull out of a bottle. Agencies combine a visual shoreline survey, bottle samples taken to a lab, in-water chlorophyll and turbidity sensors, satellite and drone imagery, and a growing set of molecular assays. No single instrument answers every question, which is why real monitoring programs run several methods side by side.
I have pulled the current practice together here for anyone who needs to know what a number in a bloom advisory actually came from, and what it cannot tell you. The short version: how algae blooms are detected has not changed much in its core, but the sensor side has gotten much cheaper and the satellite side much sharper.
Table of Contents
How Algae Bloom Detection Works
Algal blooms are identified by combining visual observation, physical water samples, pigment and cell measurements, and imagery from above. A trained observer spots a color change, a bottle goes to a lab for counting and taxonomy, sensors track pigment fluorescence over hours, and satellites map extent across an entire lake or coastline.
Before the methods make sense, it helps to separate the three questions every detection program has to answer, because they are not the same question and no instrument answers all three at once.
- Is algae present, and how much of it is there? Answered by cell counts, chlorophyll-a concentration, or pigment concentration from a fluorometer.
- Which species is it? Answered by microscopy, imaging flow cytometry, pigment chromatography, or genetic assays such as qPCR and eDNA metabarcoding.
- Is it producing toxins? Answered only by a chemical or immunoassay on a water sample. Neither chlorophyll nor a satellite image answers this.
That third question is where public confusion lives. A bloom can be thick, ugly, and harmless, and a nearly invisible one can close a beach. Chlorophyll-a is widely used as a proxy for cyanotoxin risk and the World Health Organization recognizes it as such, but it is a proxy, not a measurement.
The seven methods used to detect algal blooms
Seven method families cover nearly all monitoring work, and each reads a different signal.
- Visual shoreline and boat survey — a trained observer records color, surface slicks, foam lines, dead fish, and scum extent by eye or from photographs.
- Manual grab sampling and laboratory microscopy — bottles are collected, cells are counted on a slide or hemocytometer, and taxonomy is assigned from morphology.
- Fluorometers and chlorophyll-a sensors — instruments excite the pigment and measure the light it re-emits, giving a continuous chlorophyll proxy.
- In-situ imaging flow cytometry — an instrument images and counts individual cells as they pass through a capillary, unattended, at depth.
- Satellite remote sensing — water-leaving radiance is converted to pigment concentration across thousands of square kilometres.
- Drone and hyperspectral imaging — an aircraft-mounted spectrometer measures many narrow wavelength bands, resolving features that broadband sensors smear together.
- Molecular assays such as eDNA and qPCR — DNA in a water sample is amplified and identified, giving species-level answers from a small volume.
Here is how those methods compare on the properties that decide which one you pick.
| Method | What it measures | Latency | Spatial coverage | Species ID | Toxin ID |
|---|---|---|---|---|---|
| Visual survey | Colour, slicks, scum | Immediate | Shore or transect only | Approximate | No |
| Grab sample and microscopy | Cell counts, taxonomy | Hours to days | Single point | Yes | No |
| Fluorometer and chlorophyll sensor | Pigment fluorescence | Minutes, continuous | One fixed point | No | No |
| Imaging flow cytometry | Individual cells, size, fluorescence | Near real time | One fixed point | Good | No |
| Satellite | Water-leaving radiance | Days to weeks | Regional | Inferred | No |
| Drone hyperspectral | Reflectance in many bands | Same day | Bay or reservoir | Inferred | No |
| eDNA and qPCR | Target DNA sequences | Hours to days | Single point | Yes | Targeted only |
Water Sampling and Laboratory Analysis
Water sampling is the reference method every other approach gets checked against, because it is the only one that puts a physical specimen in a scientist’s hands.
How a sample is collected
A grab sample is a bottle filled at one point and one depth, usually from a boat, dock, or shoreline. Depths matter: surface water and bottom water in a stratified lake can hold completely different populations, so programs take a vertical series of discrete bottles at a station rather than one shallow scoop.
The weakness is obvious and worth saying plainly. One bottle describes one litre of one lake on one afternoon. Algal density can vary by an order of magnitude across the same water body on the same day, so a shoreline sample routinely under-reports what is happening a kilometre offshore. That is the single most common criticism of shoreline grab sampling, and it is fair.
Counting and identification in the lab
Cells are counted in a hemocytometer or counted electronically, giving a concentration in cells per millilitre, and a drop slide or settled sample gives enough cells for a taxonomist to work from under a microscope. Morphology works for large diatoms and dinoflagellates; it gets much harder for small cyanobacteria, which is why pigment analysis and genetic assays have taken over that part of the job.
Chlorophyll-a is usually measured by extracting the pigment in solvent and reading absorbance with a spectrophotometer, or by fluorometric method without extraction. Extracted chlorophyll is the more accurate reading; in vivo fluorescence is faster and continuous but sensitive to how the cells are doing.
Toxin testing
Toxin testing is a chemical question answered in the lab. Assays cover microcystins, cylindrospermopsin, and anatoxin-a for cyanobacteria, and brevetoxin, domoic acid, and saxitoxin for marine dinoflagellates and diatoms. ELISA kits give a same-day answer with modest specificity. Gas chromatography and liquid chromatography coupled to mass spectrometry cost more and take longer, and they are the reference method when the stakes are high, such as a drinking water intake or a shellfish bed.
None of that is instantaneous. A confirmed result can take a day or more, and by then the water mass that carried the bloom has often moved. That lag is the core reason in-water sensors and satellite screening matter.
How Algae Blooms Are Detected With In-Water Sensors
In-water sensors detect a bloom by measuring pigment fluorescence and the optical and chemical conditions that let a bloom grow, and they report the reading in minutes rather than days.
Pigment fluorescence is the working principle
Chlorophyll fluoresces. Shine a light at a short wavelength, around 470 nanometres, and chlorophyll-a re-emits near 685 nanometres, plus a weaker band near 700. A fluorometer measures that emitted light and converts it to a chlorophyll concentration. The result is continuous, cheap enough to run unattended, and sensitive enough to catch a bloom building before anyone can see it.
Phycoerythrin, a pigment common in marine cyanobacteria, also fluoresces strongly around 640 nanometres when excited near 560, which lets some instruments separate a blue-green bloom from a diatom bloom. The catch is that fluorescence is a pigment proxy, not a cell count, and two very different species can produce the same reading.
The companion probes that explain a bloom
An algae sensor is rarely useful alone, so field packages pair the fluorometer with a few more measurements. A temperature probe matters because warm water and a stable thermocline let a bloom hold position. Turbidity and optical backscatter sensors measure how much material is in the water, and optical density sensors help separate an algal signal from suspended sediment. A dissolved oxygen probe is the most useful early warning of consequence: a bloom that starts producing oxygen in daylight can strip it out at night, and a crashing overnight minimum is what kills fish.
Acoustic Doppler current profilers add the movement of the water, which tells you whether a bloom is drifting, mixing, or trapped. Some packages also carry a pH sensor, since dense algae photosynthesis pushes pH up during the day.
In-situ imaging flow cytometry
An imaging flow cytometer counts and photographs single cells as they stream past a laser, unattended, on a schedule. Texas A&M University-Galveston has run an Imaging FlowCytobot in Galveston Bay for years as an early warning system for harmful and toxic blooms, photographing and counting phytoplankton in the water column and alerting staff when a species of interest appeared before a visible surface event. It gives cell abundance plus a rough taxonomic split from cell size, shape, and autofluorescence, and it is close to real time.
What you can build yourself
Open-hardware packages can do a credible job with a single-channel fluorometer, a temperature probe, an inclinable solar panel for power, and a microcontroller logging to an SD card with telemetry over a low-bandwidth radio. The honest limit is that a DIY chlorophyll channel is a chlorophyll channel, not a species identification, and a DIY optical backscatter sensor is easily fooled by sediment. If a project needs to publish numbers other people rely on, calibration against a commercial sensor and a real grab sample matters more than any other part of the build.
Remote Detection From Space, Aircraft, and Drones
Remote detection works by measuring the light leaving the water’s surface and reading the pigment signature in it, then converting that reflectance into a map of pigment concentration across an entire water body at once.
Every ocean colour sensor is a trade. High spectral sensitivity means the faint water-leaving signal in blue and green is measured accurately, but the swath is wide and the pixel is large. High spatial resolution means fine detail, but the instrument is less sensitive to the water signal. Land-observing satellites are built the second way, ocean-observing satellites the first. Anyone working with community science on this problem keeps running into that wall, and it is a real limit of the hardware, not user error.
Named instruments worth knowing:
- Sentinel 2 — a land-observing pair with roughly 10 metre pixels, excellent for a reservoir you can drive around.
- Sentinel 3 — ocean-observing, with coarse pixels and very high sensitivity, built for open water.
- Landsat OLI — long history, free archives, useful for trend work.
- PACE — NASA’s ocean colour instrument with finer spectral sampling of pigments, aimed at resolving pigment composition and cell size.
- TROPOMI — a spectrometer that picks up the faint red fluorescence line of chlorophyll, a signal most instruments miss.
Validation against ground truth is what separates useful imagery from a pretty picture. Work on San Luis Reservoir, published in GeoHealth, compared satellite chlorophyll products to dock-side toxin samples over 2016 to 2022 and found agreement above 79 percent for Sentinel 2 and 83 percent for Sentinel 3. That is the honest error bar on a free, open, regional product, and it is why remote sensing is used to point sampling at the places that most need a bottle.
Aircraft and drones fill the gap satellites leave
A drone carrying a hyperspectral sensor flies under the clouds, at 10 to 30 centimetre resolution, over a specific reservoir or bay on a chosen day. It can distinguish surface features a 300 metre satellite pixel averages away, and it gives a same-day result instead of a delayed one. Aircraft surveys do the same job over larger areas and with heavier, more capable instruments.
NASA researchers have also trained machine learning models on satellite, camera, and microscopy imagery, using self-supervised learning because hand-labelling satellite scenes is prohibitively expensive. Their stated aim is a tool that flags suspicious water before a bloom spreads, and fills gaps where clouds and orbits leave blind spots. The framing matters: the model is meant to tell crews where to sample, not to replace agency testing.
Combining Sensors With Field Verification
Field verification means pairing a sensor reading with a physical sample taken at the same time and place, so you can tell a real bloom from a drifting cloud, a sediment plume, or a fouled lens.
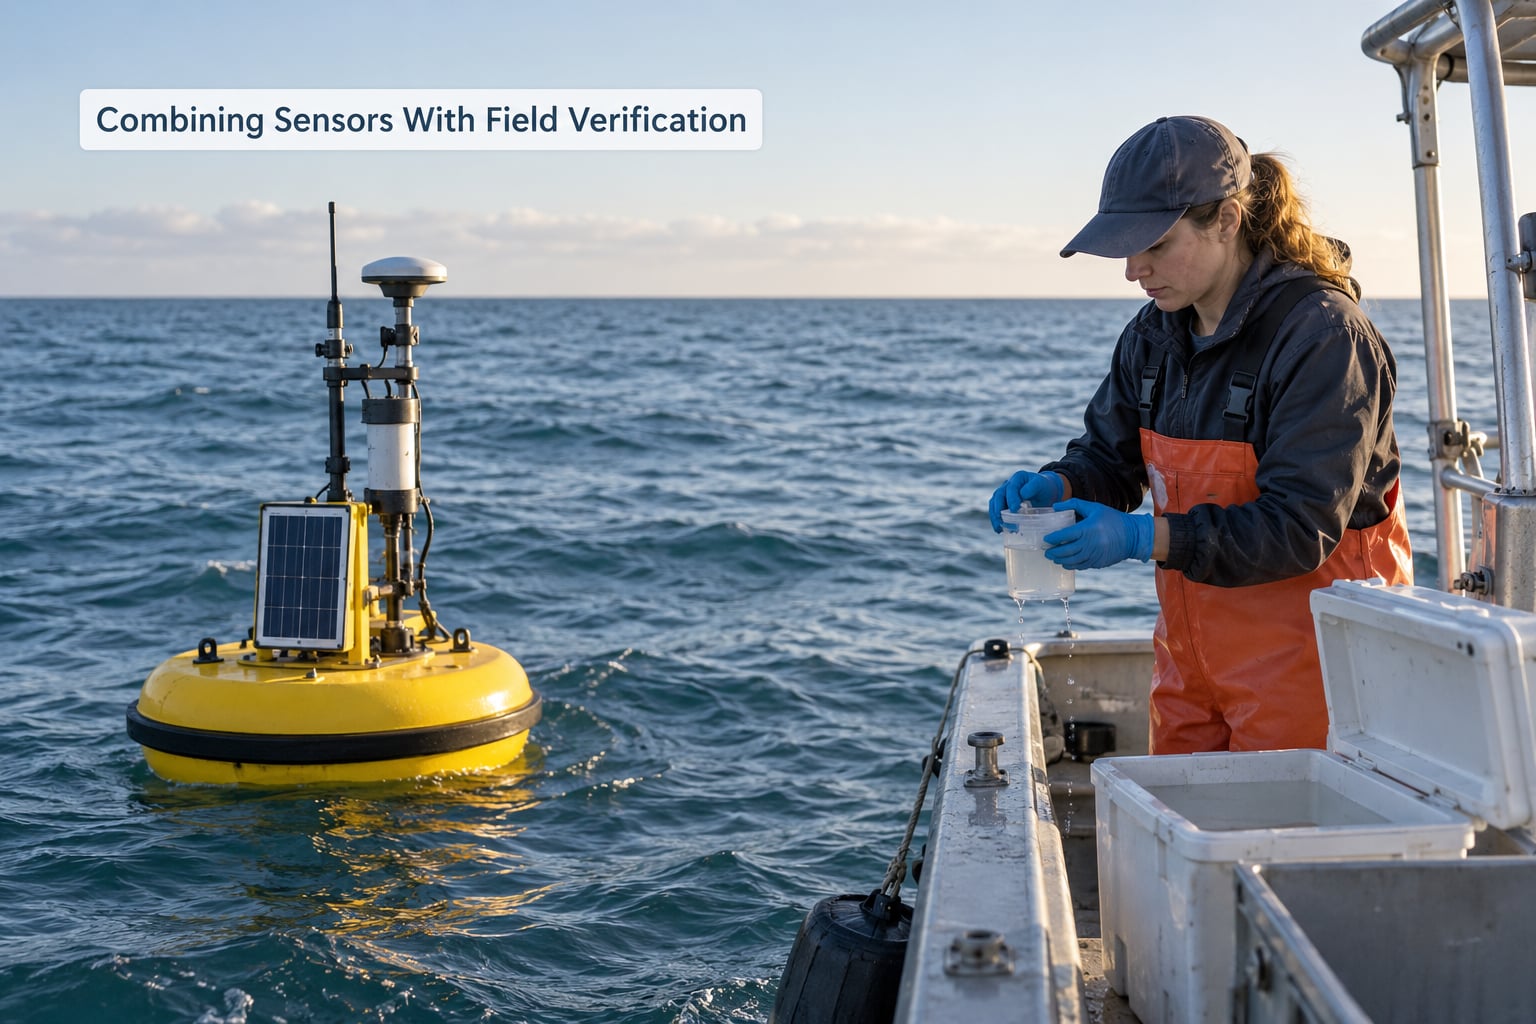
A working monitoring loop looks like this.
- Screen remotely. A fluorometer or satellite pass flags an anomaly.
- Send someone. A field team samples within hours at the flagged point and at one point outside it, as a control.
- Compare. Check whether the lab cell count and chlorophyll match the sensor. A sensor spike with a clean bottle is usually sediment, glare, or a fouled window.
- Identify and assay. Only now do you learn the species and whether toxins are present.
- Log the uncertainty. Record cloud cover, calibration date, sample time, and how far the bloom front moved, because those details are what make the next forecast better.
Programs that skip the control sample at step two generate false alarms, and teams that skip the uncertainty log end up unable to defend a threshold later. Both failures show up in the literature.
What Can Make Detection Difficult?
Detection gets hard when the signal a method relies on is not what it thinks it is, and most of the frustrating cases come down to water, weather, and maintenance.
Clouds and sun glint. Satellite imagery is useless under cloud cover, and specular reflection off a calm surface can be brighter than the water signal itself. Algorithms work around both, and the work-around is never perfect.
Suspended sediment. In shallow water or after a storm, a turbidity signal can be indistinguishable from an algal one, especially from a purely optical sensor.
Patchiness. Blooms are not uniform. A bloom that looks like a solid green sheet from the dock can be a thin layer over clear water, and a clear surface can hide a dense subsurface population.
Surface versus water column. Wind can hold a bloom at the surface while the water underneath stays clear, or drive it down. Surface remote sensing and an integrated bottle sample can disagree completely on the same afternoon.
Fouling and drift. Biofouling on an optical window shifts the baseline, and electronics drift out of calibration. Neither announces itself in the data; both look like real change until you compare against a clean reference.
Non-chlorophyll blooms. Some harmful species are not well represented by chlorophyll-a, and some pigments mask or mimic the signal. A bloom that chlorophyll says is mild can still be a closure.
Depth and bottom. In shallow clear water, light bounces off the bottom and inflates the apparent water-leaving signal.
Frequently Asked Questions
How often should algae blooms be monitored?
Frequency depends on how fast the water changes. Coastal programs sample weekly during the season and step up to daily when conditions are warm, stable, and nutrient-rich. A drinking water reservoir with a history of blooms usually pairs continuous sensor logging with weekly bottles, then pulls daily samples during the growth window. Continuous sensors do the watching, and bottles confirm. Missing the first warm, stable week is the most common way a program gets caught short.
Can satellite imagery detect every algae bloom?
No. Satellites see roughly the top few metres, they need clear skies, and their pixels average over hundreds of metres to kilometres. A bloom that is thin, subsurface, patchy, or hidden under cloud is easy to miss, and suspended sediment in shallow water can imitate a bloom signal. That is why open-water chlorophyll products are used to decide where to send a boat, not to close a question.
What sensor is best for low-cost algae monitoring?
For most lake and pond projects, a single-channel chlorophyll fluorometer with a temperature probe, solar power, and a logging microcontroller is the highest-value combination. Add a turbidity or optical backscatter channel if sediment is common in your water. A dissolved oxygen probe is worth the cost wherever fish kills are a concern. Spend the savings on calibration against one commercial instrument and one lab sample.
Can an algae bloom be identified from water color alone?
No. Color gives you a suspicion and a rough severity, nothing more. Brown water often means diatoms, bright green usually points to cyanobacteria, and red or rust tones to some dinoflagellates, but non-toxic and toxic strains of the same species look identical. Color also changes with sediment, lighting, depth, and camera settings. Identification needs a count, a taxon, or a genetic assay.
How can people tell whether an algae bloom produces toxins?
Only a test on a water sample answers that, and it has to be the right test for the species. Cyanobacteria are screened for microcystins, cylindrospermopsin, and anatoxin-a; marine blooms are screened for brevetoxin, domoic acid, and saxitoxin. Fast immunoassay kits give same-day results, while chromatography with mass spectrometry is the reference method. Until a lab result comes back, treat a dense bloom as potentially toxic.
Where to Start
Start by writing down the decision you actually need to make. A drinking water utility needs a toxin assay and a defensible number before an intake. A coastal program needs extent and drift, which means imagery. A pond owner needs a threshold that triggers an aeration decision.
Then take enough bottles through one full season to know your baseline, including how cell counts vary from the shore to the middle of the water. After that, pick sensors and remote data that match the bloom you actually get. If the full phrase you are searching for has a short answer, it is this: how algae blooms are detected works best as a layered system, where a fast signal points to a place and a laboratory result tells you what is actually in the water.