Reading a nautical chart is mostly pattern recognition: find the title block, learn the scale, work out what the numbers mean, then match the symbols to what you can see out the window. Give it one focused session of 60 to 90 minutes with a real NOAA chart and you will be able to plan a short coastal passage on your own. It feels harder than it is, mostly because nobody explains the abbreviations on the way in.
This guide walks a chart in a fixed order, the same order every time, so you never have to guess where to look. It works for paper charts, for Navionics-style apps, and for the free NOAA chart viewer. Where a rule comes from the international symbol standard or from NOAA’s own reference, it is named.
Table of Contents
- What You Need
- Step-by-Step: How to Read a Nautical Chart for Beginners
- Common Mistakes
- Frequently Asked Questions
- What do the numbers on a nautical chart mean?
- What does the scale 1:50,000 mean on a nautical chart?
- How do I find my boat’s position on a nautical chart?
- Why doesn’t my GPS position match where I am on the nautical chart?
- How do I look up a chart symbol I don’t recognize?
- Do I still need paper charts if I have a chartplotter?
What You Need
Six items, and only two of them cost money. Everything else is either free or already on the boat.
- The chart itself. A current NOAA chart covering your area, or a printout from the NOAA chart viewer.
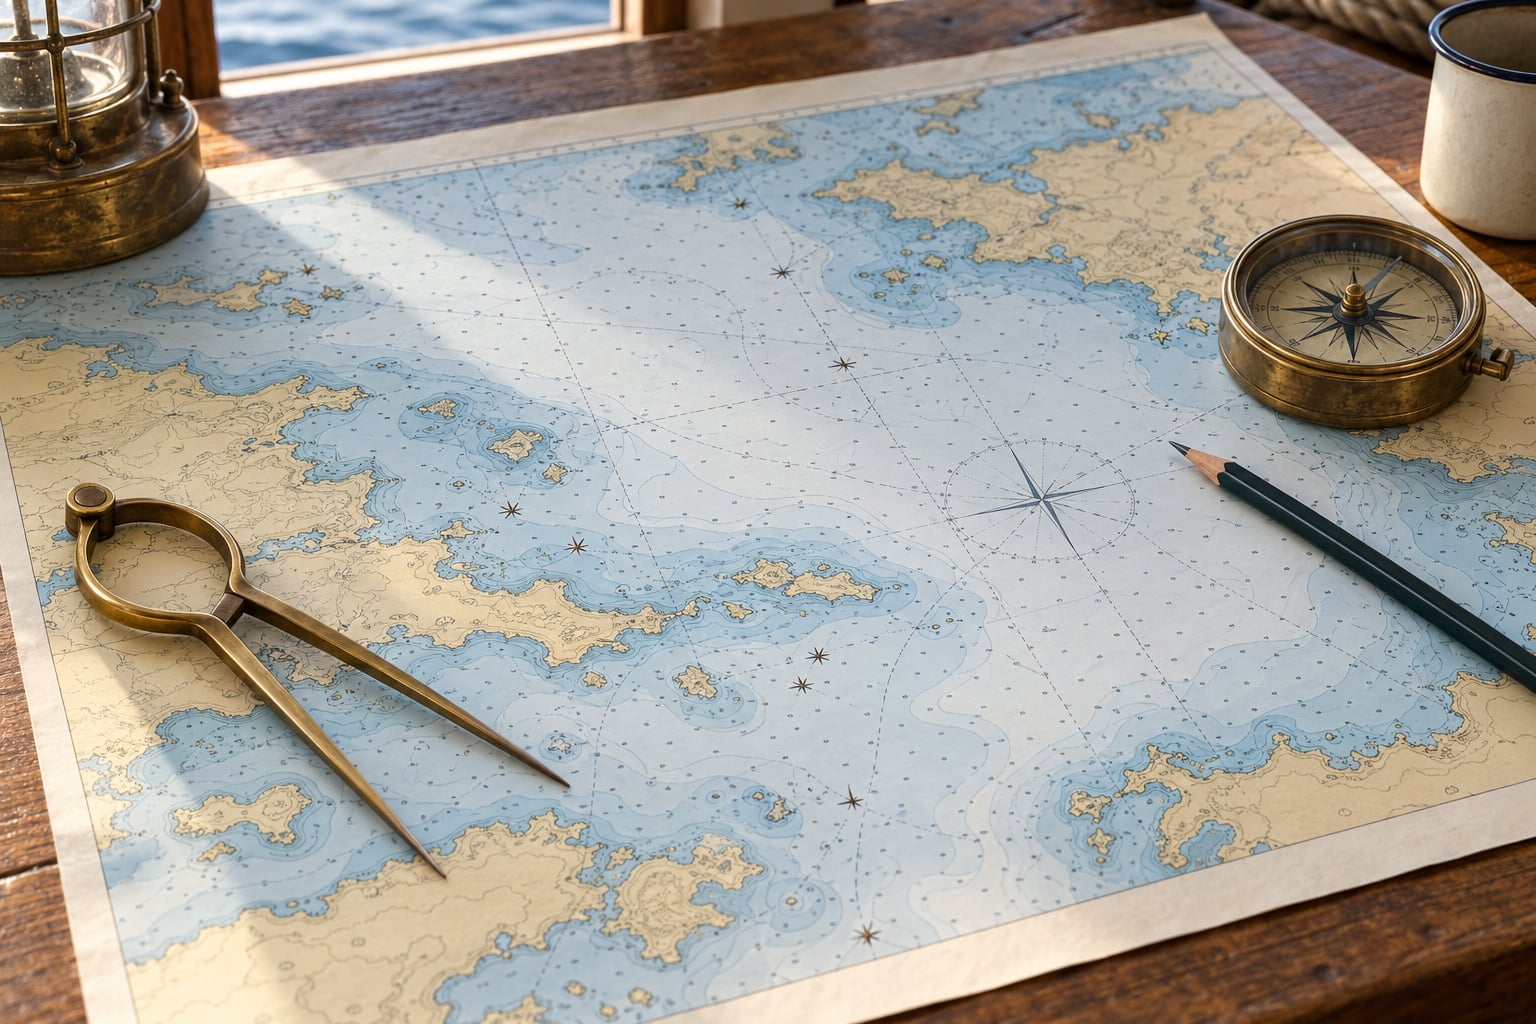
- Dividers. Two pointed legs with a hinge. They are the single most useful navigation tool and cost less than a sandwich.
- A parallel rule. Optional at first. It walks bearings across the chart without you lifting the dividers.
- A sharpened pencil and a soft eraser. Your marks go on a working chart or a transparent overlay, never on a good paper chart.
- A notebook. For copying coordinates, light characteristics and buoy notes before you leave the dock.
- NOAA U.S. Chart No. 1. The official booklet of chart symbols and abbreviations, free to read online through NOAA’s Office of Coast Survey. Every unexplained glyph gets looked up here.
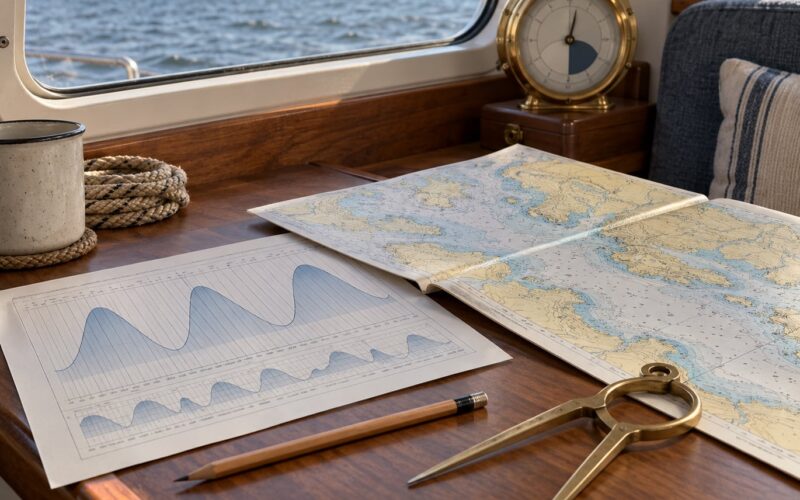
Add a pair of tide tables for your area. A chart tells you depth at chart datum, and the tide tables tell you how much water is on top of that right now.
Step-by-Step: How to Read a Nautical Chart for Beginners
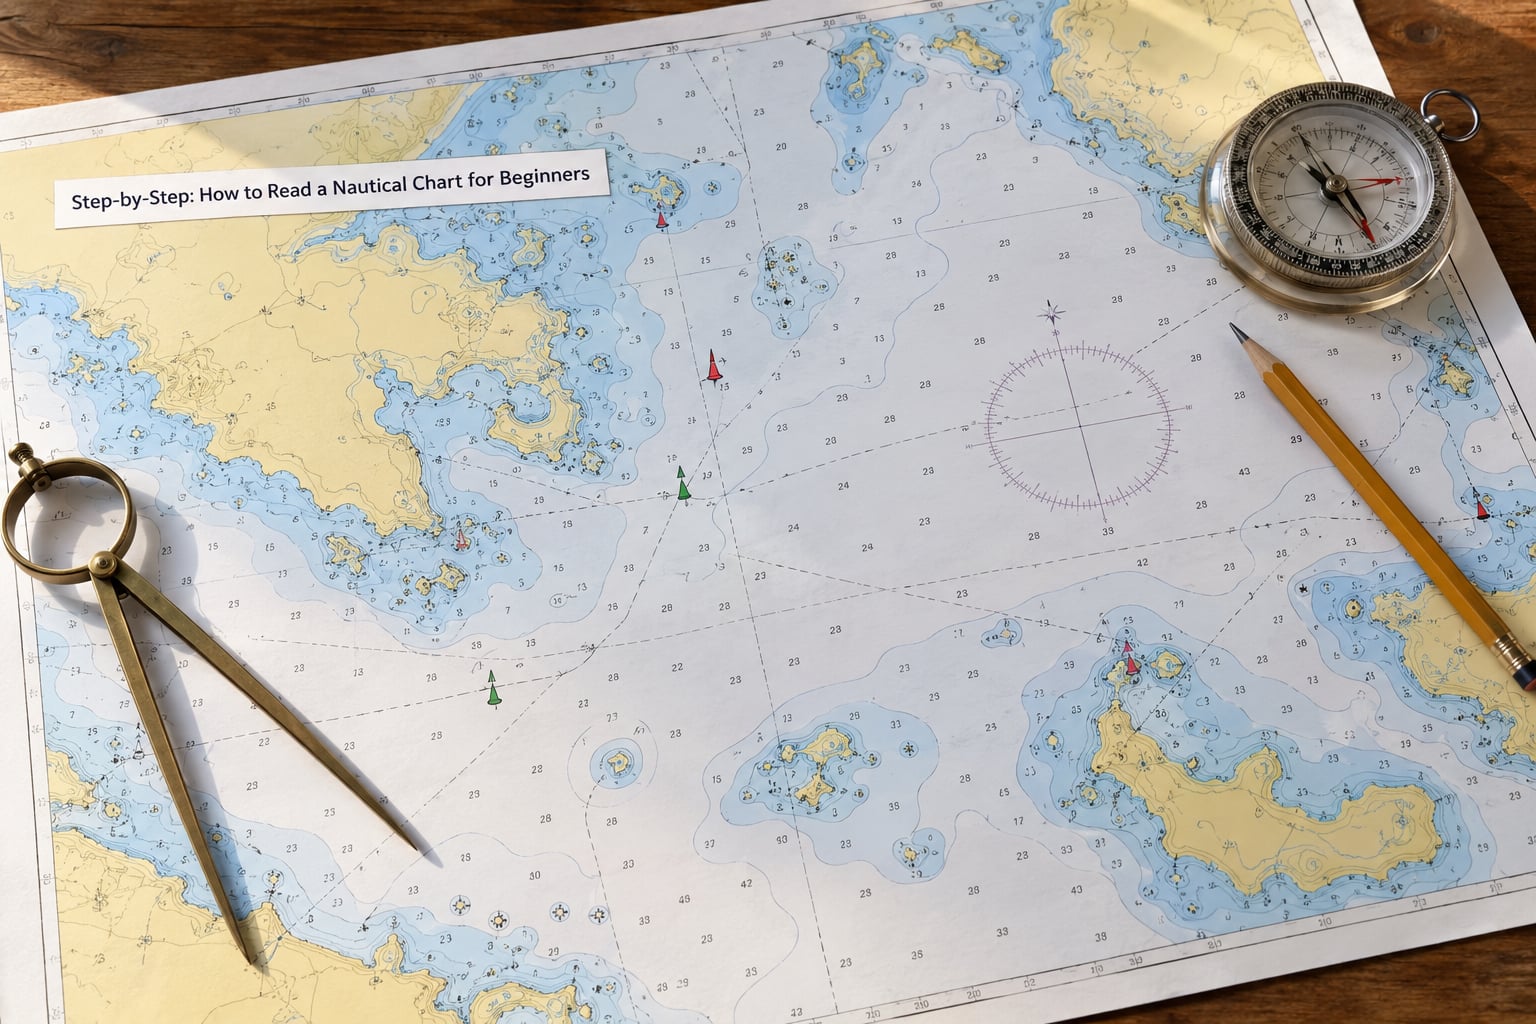
The sequence below takes about an hour on a real chart. Follow it once and the order sticks, which means later trips take minutes instead of an hour.
1. Identify the Chart Type, Scale and Coverage
Start in the title block, usually printed in a box in a corner of the sheet. It gives you the chart number, the geographic area covered, the projection and the scale.
Scale is a ratio. A chart at 1:50,000 means one inch on paper equals 50,000 inches on the water. That works out to roughly 4,167 feet, a bit more than the length of a football field. One full inch of that chart covers about four tenths of a mile of real coastline.
Large scale means large denominator and small area: a harbor chart at 1:5,000 gives you one inch for every 417 feet, detailed enough to see individual mooring fields. Small scale like 1:50,000 or 1:1,000,000 covers a coastline but crams the detail. Coastal work wants both: a small-scale chart for the approach, a large-scale one for the harbor itself.
2. Learn the Depth Numbers and Units
The numbers printed on the chart are depth soundings, measured by echo sounder or lead line. The numbers you see are depths below chart datum, not below whatever the water happens to be doing that afternoon.
Three details catch out beginners:
- Units. US charts use feet or fathoms, most of the rest of the world uses metres. One fathom equals six feet, or 1.83 metres. The unit is printed on the chart and beside each sounding in large charts.
- Underlined soundings. An underlined number dries at low tide. Blue dotted areas and green tint mark ground that is covered only part of the time. You cannot take a boat over it except at high water with enough depth to spare.
- Contours and shading. Depth contour lines join equal depths. White means deep, pale blue then darker blue shows you approaching the shallows, and green or tan on the edges is intertidal ground that dries.
Chart datum is the reference surface. In US waters it is usually lowest astronomical tide, an extremely low tide level, which makes charted depths conservative: at normal high tide you have more water than the chart shows. Underlined soundings are the exception that proves the rule, because they dry below that level.
3. Understand the Compass and Direction System
Three norths confuse everyone once. True north is the Earth’s axis. Magnetic north is where a compass needle points. Relative bearing is just the angle measured from your boat’s bow.
The compass rose on the chart bridges them. The outer ring is true, the inner ring is magnetic, and the difference between them is magnetic variation, printed in degrees with an annual rate of change. Variation shifts a degree or two most years in most places, which is why older paper charts drift from your compass.
To take a bearing with dividers: place one point on the object, swing the other leg to the inner magnetic ring, and read the angle from your boat’s direction to the object. Keep your hand steady, because a two-degree error over a mile of run puts you well off the target.
For distance, use the latitude scale on the left or right margin. One minute of latitude equals one nautical mile, and one nautical mile is 6,076 feet. Never measure distance off the longitude scale, because degrees of longitude shrink as you move away from the prime meridian.
4. Decode Nautical Chart Symbols
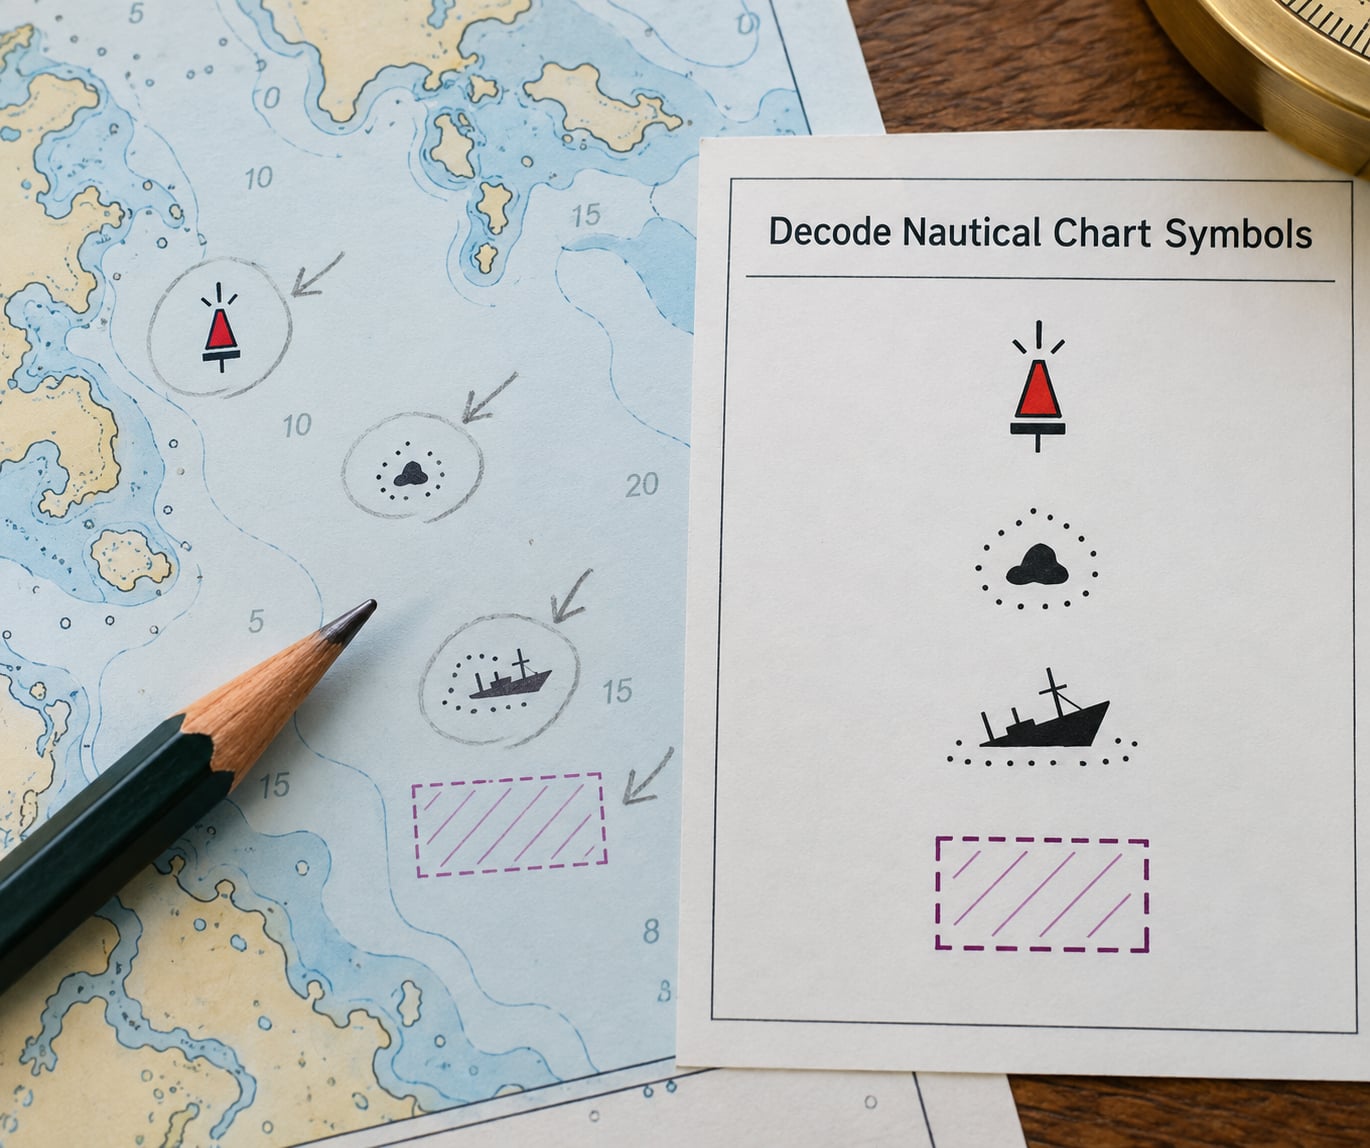
Symbols are grouped by shape, which makes them learnable rather than random.
Buoys are drawn as their physical shape: a can is a flat-topped cylinder, a cone is a triangle, a pillar is a rectangle, a sphere is a circle. A buoy with a light gets a small flare or star. When you come inbound from seaward, the mnemonic is ‘red right returning’. In IALA Region A, which covers the Americas and much of the rest of the world, red marks are on your starboard side and green to port. Some regions reverse the colours, and the chart’s notes tell you which system applies.
Light characteristics are abbreviations next to the flare: Fl flashing, Oc occulting, Iso isophase, Q quick flashing, R interrupted. Fl(2) 10s means two flashes every ten seconds. A number over a light is its height in feet above mean high water. Light lists give you these details for every aid in an area, and they pair with the chart symbol to confirm you have picked the right one.
Hazards carry their own shapes. A plus sign marks a rock that is always uncovered, an asterisk marks one that is covered at high water, and a cross with dots on the arms marks a rock that is awash. Wrecks show a hull outline with a mast, and the dotted version means the wreck is only partly showing. Anchor symbols mark fouling ground, where a hook is likely to catch. Magenta tint and purple hatching are used for man-made features that are conspicuous above water, airport obstacle lights and overhead cables among them.
Restricted areas use dashed outlines with a label: magenta for danger areas, green for restricted, blue for caution. Fishing limits, cable areas and military exercise zones all use this system. When a symbol is unfamiliar, look it up in NOAA Chart No. 1 rather than guessing.
5. Read the Shoreline, Landmarks and Water Features
The coastline is the fastest orientation tool you have. Compare the shape of the chart’s shore with what you can see from the helm and you will usually place yourself within a couple of minutes.
Look for hard features: piers running out into the water, breakwaters marking harbour entrances, jetties, and buildings drawn as solid blocks. A chart shows a bridge clearance figure underneath the span, and that figure is measured from highest astronomical tide, so subtract your actual tide height from it before you judge whether you pass.
Tidal diamonds, small diamonds printed in open water with numbers inside, tell you the height of tide above chart datum at a specific spot. Useful for deciding whether a drying bar or a shallow slip is passable at the time you intend to use it.
6. Plot and Check a Simple Route
Plotting a route takes five moves, and you can do the whole thing with dividers and pencil.
- Mark start and finish. Your berth or the marina entrance, and the anchorage or dock you are aiming for.
- Set dividers on the destination first. Choose a waypoint that sits in the middle of clear water rather than on top of the target itself, because you will approach it from different directions.
- Walk the route through open water. Keep a margin between your track and any charted hazard. Working at one third of the available depth leaves room for swell, tide and error.
- Measure the legs. Open the dividers on the latitude scale and walk it along each leg, noting the distance in nautical miles.
- Draw it in pencil and re-check it. Look at every bend and ask what would hit you there if the tide were against you.
Add the tidal stream as a factor rather than an afterthought. A two-knot stream running against a four-knot boat turns a short hop into a genuinely different problem.
7. Transfer Your Chart Information to a Modern GPS
A chartplotter does not replace the chart, it just does the arithmetic faster. Knowing how to do the arithmetic by hand is what lets you check the plotter when the two disagree.
To read coordinates off paper, work inward from the nearest latitude mark on the side margin and the nearest longitude mark on the top or bottom margin. Interpolate between the minute ticks and write down the seconds. Enter those coordinates as waypoints in the unit, then run through them in order.
Positions will not match perfectly and there is a reason for it. Charts were built from surveys tied to a local datum, while your GPS works in WGS 84, a global reference. The gap between the two, called latitude of departure, can be tens of metres in many places and much more offshore, because the local vertical reference assumed by the surveyors does not match Earth’s actual gravity field. Newer charts reduce the error, but never to zero.
For our own work with autonomous surface vessels running coastal survey lines, the same discipline applies. Datum choice, position logging and a written plot are what let a field team reconstruct a mission a week later, and the same three habits work on a small boat.
Common Mistakes
Six errors account for most of the trouble beginners run into. Each has a simple correction.
Ignoring the scale
Using dividers to measure a distance without knowing the ratio, or estimating it by eye. Read the scale first, then measure with dividers against the latitude scale. Eye estimates on a small-scale chart are wrong by a factor of ten more often than people expect.
Treating an underlined sounding as usable depth
Underlined numbers and blue dotted areas dry at low tide, and green tint marks intertidal ground. The fix is to read the underline before the number, and check tide height against the sounding before committing.
Reading a sounding as the depth you will have
Charted depth is measured from chart datum, not from the surface. If your chart datum is lowest astronomical tide, you will nearly always have more water than the chart says. The exception is underlined soundings, which dry below datum, and those are the ones to watch.
Using an old edition and skipping Notices to Mariners
Beacons get moved, lights change character, shoals get surveyed. Check the edition date in the title block, read the Local Notice to Mariners for your area before departure, and apply the corrections to your working chart. If the edition date is more than a few years old and nothing has been updated, assume something below the surface has changed.
Measuring distance off the wrong scale or mixing true and magnetic
Longitude degrees shrink toward the poles, so distance measured off them is short. And variation shifts every year, so a magnetic bearing read off an old chart drifts. Use the latitude scale, and add or subtract the printed variation to go from true to magnetic.
Treating electronics as a replacement for the chart
A chartplotter shows a database, and databases fail: a failed antenna, a corrupted card, a software update at the wrong moment. Power loss takes the screen with it. Carry paper, keep it corrected, and know how to lay a course on it with dividers so that reading is a real fallback rather than a hope.
Two habits close most of the gap. Look up every symbol you do not recognise in NOAA U.S. Chart No. 1 the moment you see it, and cross-check the chart against your eyes every time you approach a mark. If a charted buoy is not where it should be, trust what you can see and say so over the radio rather than assuming the paper is right.
Frequently Asked Questions
What do the numbers on a nautical chart mean?
They are depth soundings: the depth of water measured in feet, fathoms or metres from chart datum, not from the current surface. An underlined sounding dries at low tide. In US waters the datum is usually lowest astronomical tide, so real depth is normally deeper than the number. Blue dotted areas and green tint mark ground that is covered only part of the time.
What does the scale 1:50,000 mean on a nautical chart?
It means one inch on the chart equals 50,000 inches on the water, which is about 4,167 feet or roughly a football field. A chart at that scale covers a long stretch of coastline but shows little detail, which is why you also carry a large-scale harbor chart for the last mile of the trip.
How do I find my boat’s position on a nautical chart?
Work in from the latitude marks on the side margin and the longitude marks on the top and bottom, interpolating between minute ticks. Divide the gap into seconds by eye. Plot your position, note the time, then check it against shoreline shape and any visible aids to navigation before trusting it.
Why doesn’t my GPS position match where I am on the nautical chart?
Charts are tied to a local survey datum while GPS works in WGS 84, and the gap between them is called latitude of departure. It can be tens of metres in coastal waters and larger offshore. Charted positions also refer to charted objects such as a buoy, which may have moved since the survey.
How do I look up a chart symbol I don’t recognize?
NOAA publishes U.S. Chart No. 1, the official reference of chart symbols and abbreviations, free online through the Office of Coast Survey. Outside US waters, the equivalent is IHO publication INT 1. Read the new symbol with an unknown meaning and check it there rather than guessing.
Do I still need paper charts if I have a chartplotter?
Yes, as a backup. A chartplotter depends on power, a working antenna, soundings data and software that has not just failed mid-update. Paper with dividers and pencil works when none of that does. Many skippers also find hand plotting makes them read the water better.
If you only do one thing before your next trip, spend an hour with a chart of somewhere you already know well. Pick out the harbour entrance, follow the channel in with a pencil, and check your work against the water on the way back. The skill sticks when it is tied to a coastline you have actually seen.