A tide table is a list of predicted times and heights for high and low water at one named station, and reading it takes about ten minutes once you know which column is which. The skill matters because the difference between a safe boat passage and a boat on the sand is usually about three numbers on one row. Learning how to read tide tables is really learning three things: which station the numbers belong to, what the height is measured from, and how the water moves between the printed high and low times.
This guide takes the numbers one at a time, then puts them to work for a real trip. It is aimed at small-boat owners, sailors, people launching from a beach, and anyone deploying instruments into coastal water. No equipment is needed beyond the table itself and your boat’s draft.
What You Need
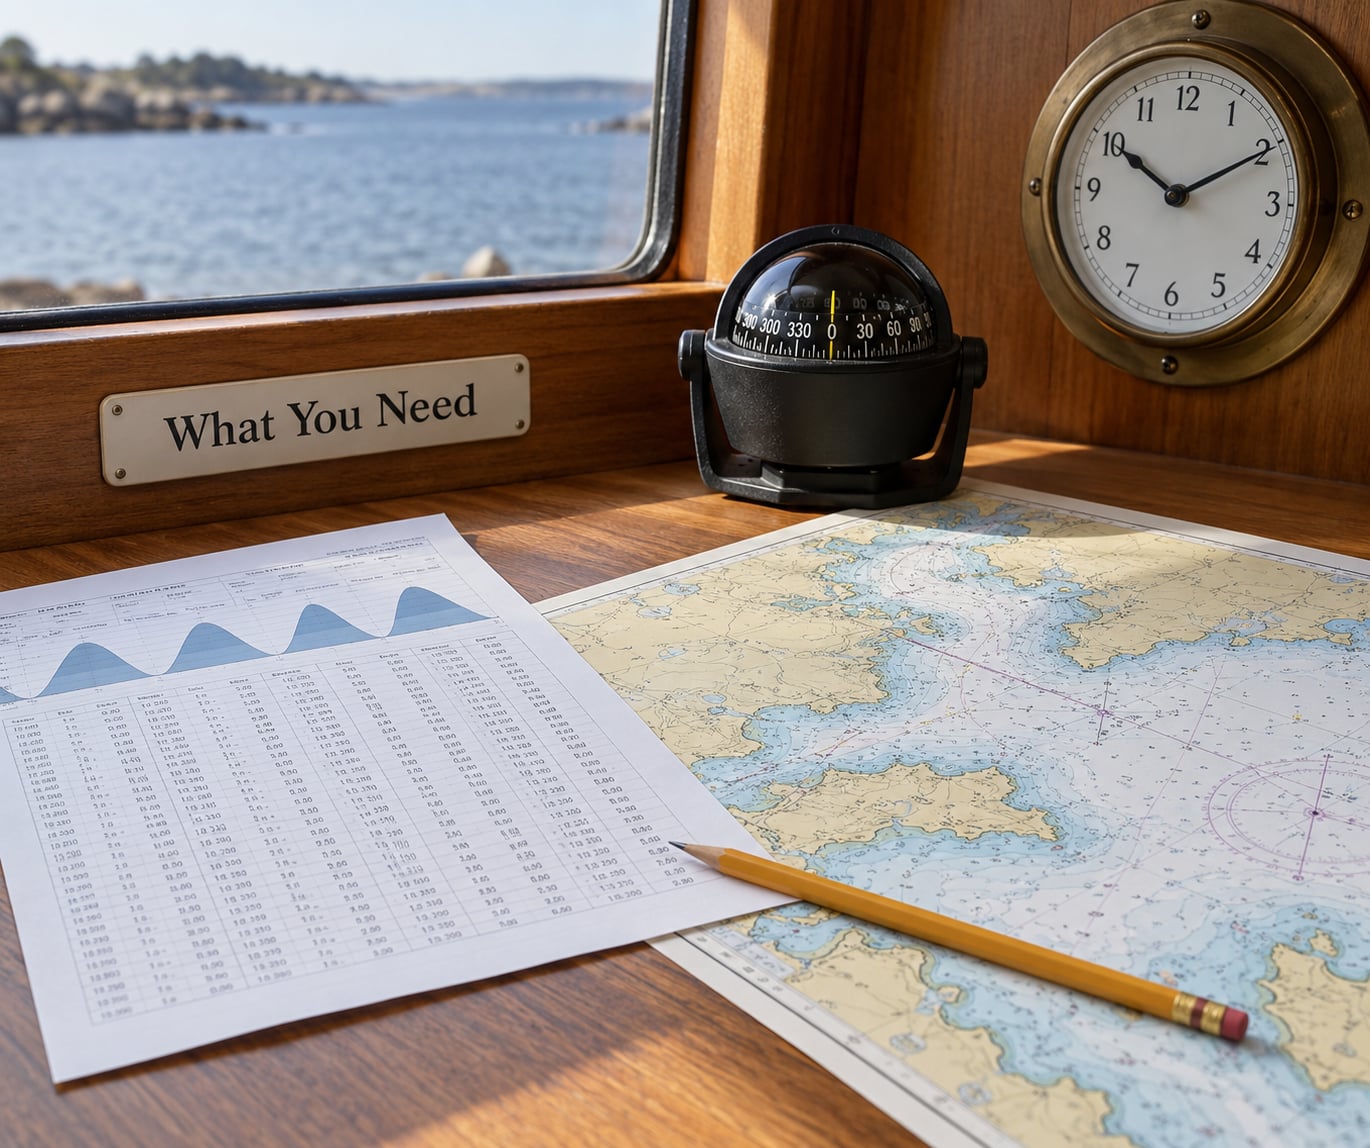
Before you read a single number, gather the reference details. A tide table without a station name is not information, it is decoration.
- The tide table and its station name. Official predictions are published per station, and a neighbouring station can run an hour or more off in time and a foot or more off in height.
- The date. Tides shift by roughly 50 minutes later each day, so a table from the wrong day is wrong in both directions.
- Units and time zone. Know whether heights are in feet or meters, and whether the times are local, a named zone, or Greenwich.
- The chart datum for that station. In U.S. waters that is usually mean lower low water, the average of the lowest low tides over a full lunar cycle.
- A tidal current table or chart. Heights and currents are different documents, and a tide table never tells you how fast the water is moving.
- Your vessel’s draft or your foot clearance. The number that decides whether the bar is open.
- Local warnings and the marine forecast. NOAA Tides and Currents and the National Weather Service both publish these, and both override your table.
Step-by-Step
Step 1: Confirm the Location and Date
Read the station name first, then read the date. The station name tells you the reference point, and every time and height on the page refers back to that one point on the coast.
Open-water stations sit on the coast; harbor and estuary stations sit inside them, and inside water lags and stretches. A bay two miles wide can turn an open-coast high water nearly two hours later and cut the range by half. If you can only find one station, pick the one closest to your actual work area rather than the one with the friendliest name.
Then check the time zone. U.S. tide tables are published in local time and often print a separate line for daylight saving time. A table that says 2:15 PM standard means 3:15 PM on a summer afternoon, and an hour of confusion here is an hour of confusion everywhere downstream.
Step 2: Find High and Low Tide Times
Each row gives one event: a time, a height, and a label. High water and low water rows are the ones labeled H and L, and everything between them is movement rather than a standing value.
Most U.S. coasts are semidiurnal, which means two high tides and two low tides a day, roughly 6 hours and 12 minutes apart. That interval comes from the lunar day, and it is why the second high tide is always a little later than the first. A few places, including parts of the Gulf Coast and the Mediterranean, are diurnal and get one high and one low a day, so a two-highs-and-two-lows expectation simply does not fit there.
You will also see interval and hourly rows in some tables. Interval rows give the length of time between successive highs or lows. Hourly rows give a height for each clock hour, which is easier to scan for a long working window. Neither replaces the H and L rows; they fill in between them.
How you know it worked: the sequence reads as a repeating pattern of a rise, a peak, a fall, a trough, and a rise again, and the spacing between peaks is close to 6 hours and 12 minutes.
Step 3: Read Tide Heights and Ranges
Heights are measured up from the chart datum, not from the beach, not from mean sea level, and not from the water you can see this morning. The datum is the fixed reference that makes one station comparable to another.
Mean lower low water, or MLLW, is the U.S. standard: the average height of the lowest tide recorded over a 19-year cycle. Because it is an average, roughly half of all low tides fall below it. A printed height of minus 0.4 ft is a normal tide that happens to be lower than the average. People call these minus tides, and they are exactly when the flat rock shelf and the bottom sandbars expose themselves.
Work out the range for your location by subtracting the low from the high in the same row block. A station with 1 ft of range is a quiet, slow water place. A station with 12 ft is a place where the anchor, the mooring and the current all have to be planned around. The range also tells you how much water is under your keel at the worst moment, which is the number that grounds boats.
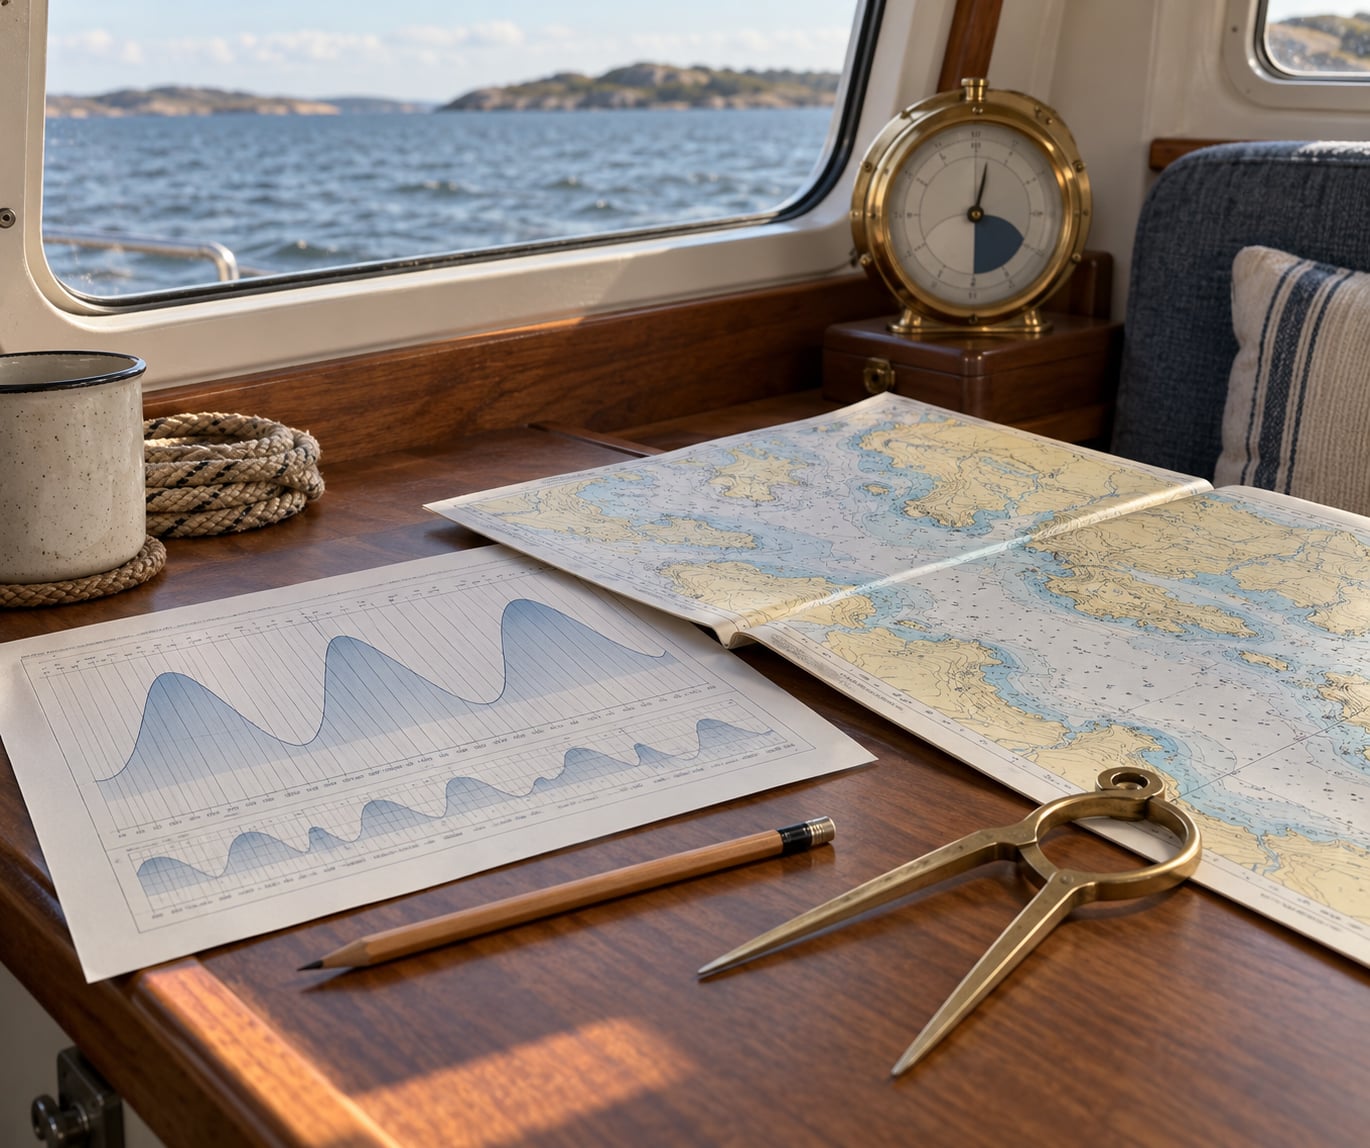
One more thing worth reading on the same page: the tidal curve version of the same data, if the source offers it. On a curve, the peak is the high water and the trough is the low water. The steeper the slope, the faster the water is moving. The flattest point, roughly halfway between a peak and a trough, is the closest a graph gets to slack water, and the steepest point is the strongest ebb or flood.
Step 4: Check How to Read Tide Tables for Your Route
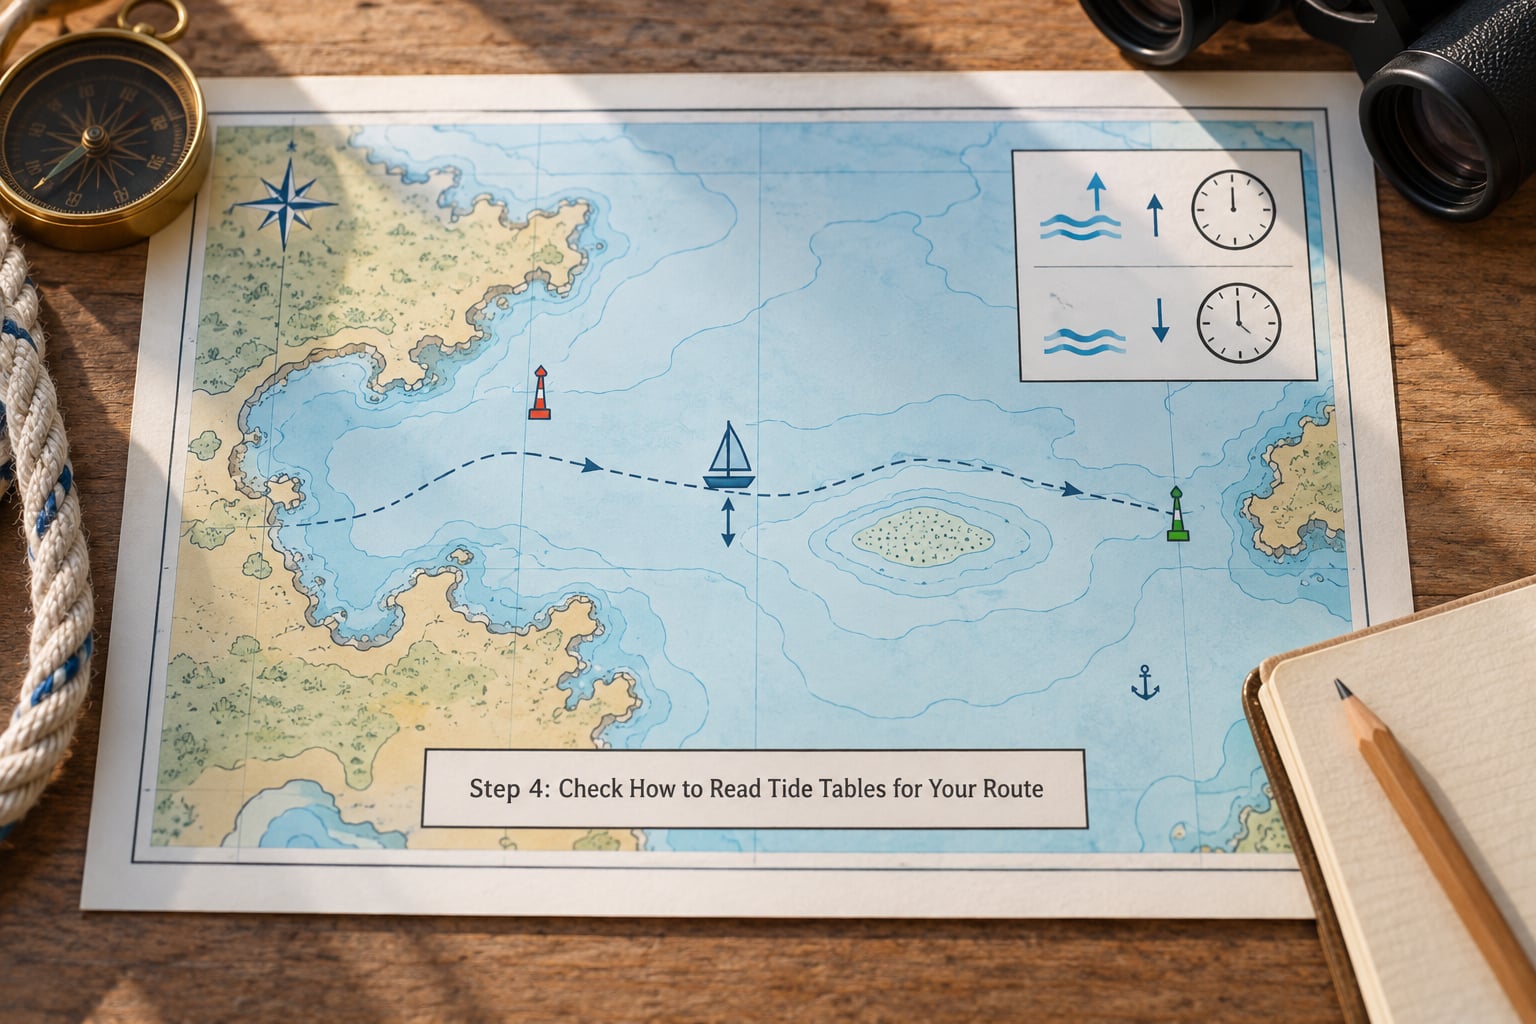
Now turn the numbers into a plan. Suppose your passage crosses a bar that has 4 ft of water over it at mean lower low water, and your boat draws 3 ft. You need one foot of clearance, and you want more than that in any swell.
Read the row for your date. Say the low water of 1.2 ft is at 6:40 AM and the high water of 8.1 ft is at 1:05 PM, giving a range of 6.9 ft. The bar is comfortably open somewhere in the middle of that rise, not at 6:40 AM and not at 1:05 PM. Using the rule of twelfths, the first hour after low water gains about one twelfth of the range, roughly 0.6 ft, so at 7:40 AM you have about 1.8 ft at the station and nowhere near enough clearance.
By three hours after low water the rule of twelfths gives you about a quarter of the range, around 1.7 ft above low, so roughly 2.9 ft. Still not enough. The real answer is the end of the flood: aim to be over the bar in the last hour before high water, plan arrival for 12:30 PM, and be clear before 1:30 PM when the water starts to fall. Regulars get this right for one reason, they arrive before the window opens rather than at its edge.
Run the same numbers for the anchor. If you put down on a scope of five times your draft at high water, the same scope is a longer chain and a tighter radius at low water, and on a falling tide the boat swings toward you. If the range is large, either lay more scope than feels generous or move to a mooring.
For shore work, reverse the logic. Low water of minus 0.6 ft at 4:20 PM gives you the longest window of exposed flat for a beach survey or a clam walk, and the water is falling before that, so leave your low-water cut-off earlier than the printed time.
How you know it worked: your plan names a clock time to be in position, a clock time to be finished, and a required water depth you can point to in the table.
Step 5: Combine Predictions with Local Conditions
A tide table predicts the astronomical tide, which is the part driven by the moon, the sun and the shape of the coast. The water you stand in also gets pushed by weather, and on a bad day the weather wins.
Barometric pressure does the most damage. A drop of about one inch of mercury in three hours typically raises water by close to a foot, because a low-pressure system over a coastline has less air above it and the sea responds upward. Sustained onshore wind piles water against the shore, and an offshore wind pulls it away. Swell changes how water stacks up in shallow areas, and a storm surge is what happens when a strong low and a strong onshore wind arrive together.
So the predicted numbers are a plan, not a promise. Check the marine forecast the morning you leave, check it again before you commit to a bar crossing, and build a margin into the window. If the forecast shows a pressure fall or a strengthening onshore wind, widen your clearance requirement and consider waiting a cycle.
One practical habit from experienced sailors: take a screenshot of the tide and current tables before you leave. Reception dies in coves and in estuaries exactly where the tide is doing the most work.
Common Mistakes
Most problems come from a handful of repeated errors, and each one has a simple fix.
- Using the wrong station. Times and heights at a station two miles away can differ by hours. Fix: pick the station nearest your actual work area, and note in writing that you did.
- Ignoring the time zone and the daylight saving line. Fix: check the header once, then stop thinking about it.
- Treating the tide as a current. Height and current are separate documents. Fix: pull the tidal current table for the same station and treat slack water as its own event, typically about 50 minutes after low water and 90 minutes after high water.
- Reading low water as a deadline rather than a midpoint. The printed low is an instant, not a window. Fix: set your own finish time an hour or more before it.
- Dropping the height number and keeping only the time. Two places can share a low water time with heights two feet apart. Fix: write both numbers down.
- Assuming calm weather means a normal tide. Fix: check pressure and wind, and treat the prediction as a baseline only.
A short safety checklist before any trip: station and date confirmed, time zone confirmed, datum understood, draft or clearance requirement written down, current table checked, marine forecast checked, arrival before the window opens, and a plan to abort if the water is not there.
One more caution, mostly for intertidal work. A window that ends at low water still has a rising tide behind it, and a calm surface offshore says nothing about a wind-driven surf zone. Check local advisories, tell someone your plan and your return time, and never turn your back on the water.
Frequently Asked Questions
What is the 50/90 rule for tides?
The 50/90 rule estimates when slack water arrives without a current table: slack typically falls about 50 minutes after low water and about 90 minutes after high water. The tide reverses direction at that moment, not at the printed high or low time. The gap varies by port and by the shape of the channel, so treat the rule as a rough guide and confirm with a tidal current table for the station.
How do I read a tide clock?
A tide clock has a single hand that points to the water height expected right now, read against a scale of hours around the bezel. The hand sits at the high-water hour at high water and at the low-water hour at low water, and it moves continuously in between rather than jumping. Many clocks have a second hand for minutes and an adjustable bezel so you can set the station’s high and low hours. It shows height, not current.
What is the rule of twelfths in boating?
The rule of twelfths estimates the tide height at any moment between high and low water. Divide the tidal range into twelve equal parts, then add roughly one part in the first hour after low water, two parts in the second hour, three in the third, three in the fourth, two in the fifth, and one in the sixth. The pattern is symmetric on the ebb. It assumes a roughly sinusoidal curve, so use it for estimation, never for a bar crossing.
Which is better, high or low tide?
It depends entirely on the task. Boats want high water because it adds depth over bars and shoals. Clammers, beachcombers and tide poolers want low or minus water, which exposes the flat. Photographers often want the change rather than either extreme. Sensors and ocean robots are usually deployed or recovered near slack, when the current is weakest. Pick the table value that matches the job rather than a habit.
What does MLLW mean on a tide table?
MLLW stands for mean lower low water, the U.S. chart datum. It is the average height of the lowest low tide recorded at a station over a full 19-year tidal cycle, and tide heights are published as distances above or below it. Because it is an average rather than a floor, many low tides print as negative numbers. Those are minus tides, and they are the ones that expose sandbars and rock shelf.
Why is the actual water level different from the prediction?
Tide tables show the astronomical tide, which is only the part driven by the moon, the sun and the coastline. Weather adds the rest. A falling barometer lifts water, sustained onshore wind piles it against shore, offshore wind draws it down, and swell redistributes it in shallow water. Also check that you are reading the right station, since a nearby station can differ by an hour and a foot.
Conclusion
Start with the station name and the date, because every other number depends on them. Then find the two numbers that matter for your plan, the height you need and the time you intend to be there, and build the window around them with a margin on the early side.
Check the marine forecast and any local warnings before you commit, since weather can move the real water level away from the printed one. Do the same five minutes of work before every launch and every deployment, and the table stops being a mysterious grid of numbers and becomes a plan you can time.