Sea state is the condition of the water surface at one place and moment, described not by a single wave but by statistics: wave height, period, direction and spectrum, combined with wind and swell. It is reported on a 0-to-9 code such as the WMO sea state code, and measured from a 15-to-30 minute record of the surface.
This guide covers what is sea state and how is it measured, in the terms a mariner, engineer or robotics operator actually uses. The scale is old, but the instruments behind it are not.
Table of Contents
Key Numbers at a Glance
- Scale range: 0 (calm, glassy) to 9 (phenomenal, 14 m or more)
- Key statistic: significant wave height, Hs, the mean crest-to-trough height of the highest third of waves
- Second key statistic: peak period, Tp, the period carrying the most wave energy
- Observation window: 15 to 30 minutes, long enough to capture many wave cycles and short enough that wind and swell stay steady
- Units: metric codes use metres; the parallel Douglas sea scale tables use feet
- Working example: a forecast of 2 m (about 6.5 ft) sits at the boundary of code 4, moderate
What Is Sea State?
Sea state describes the general condition of the free surface of a large body of water with respect to wind waves and swell. The phrase sounds simple, and that is exactly why it gets misread: sea state is a statistical description of a whole patch of ocean, not the height of one wave.
A single wave crest is a measurement. Sea state is a set of measurements. Characterising it takes wave height, wave period, wave direction and the shape of the wave spectrum, and it is only meaningful when the wind and the swell arriving from elsewhere are taken into account.
Wind matters because it builds the sea and because it keeps changing it. Swell matters because a groundswell can travel thousands of kilometres and produce long, clean, regular waves long after the wind that made them has died. The same wave height can feel completely different depending on period: 4 m of short, steep wind chop is unpleasant and hard to work in, while 4 m of long-period swell is powerful but comparatively smooth to ride.
Local water conditions come in as well. Shallow water shortens and steepens waves, a headland refracts and focuses them, and a current running against the swell makes a dangerous confused sea that no single wave height number will warn you about.
Douglas published the scale that most of the world still uses in 1921, as a way for one observer to pass a rough impression of the sea to another. The World Meteorological Organization later standardised it as the WMO sea state code, adding wind sea and swell descriptors so a single report can carry two numbers instead of one.
How Is Sea State Measured on the Douglas Scale?
The Douglas sea scale runs from degree 0 to degree 9. Each degree pairs a band of wave heights with a plain-language descriptor, so a forecast can be transmitted in a few characters and understood without pictures.
The table below is the working version of the WMO sea state code, with wave heights in both metres and feet and the swell character typically reported alongside.
| Code | Descriptor | Wave height (m) | Approx. feet | Typical swell character |
|---|---|---|---|---|
| 0 | Calm (glassy) | 0 | 0 | None |
| 1 | Calm (rippled) | 0 to 0.1 | 0 to 0.5 | Low |
| 2 | Smooth (slight) | 0.1 to 0.5 | 0.5 to 1.5 | Low |
| 3 | Slight | 0.5 to 1.25 | 1.5 to 4 | Low |
| 4 | Moderate | 1.25 to 2.5 | 4 to 8 | Moderate |
| 5 | Rough | 2.5 to 4 | 8 to 13 | Moderate |
| 6 | Very rough | 4 to 6 | 13 to 20 | High |
| 7 | High | 6 to 9 | 20 to 30 | High |
| 8 | Very high | 9 to 14 | 30 to 45 | Very high |
| 9 | Phenomenal | 14 and above | 45 and above | Very high, sometimes confused |
Feet values are rounded conversions of the metric bands, which is why a code 5 reads as 8 to 13 ft in some tables and 8 to 12.5 ft in others. The metre figures are the primary ones in the WMO sea state code.
You can also work backwards from a height. The published degree-to-height regressions use the form D ≈ β + λ√H, where H is in feet. That approximation is close enough for a quick check and rough enough that you should still quote the band, not the decimal.
What Measurements Make Up a Sea-State Report?
A useful sea-state report names several variables, not one. Here are the ones that matter most.
Significant wave height (Hs). The average crest-to-trough height of the highest third of waves, which is close to what a trained observer perceives as the average of the biggest waves seen in the record. Munk formalised the procedure in 1944, and it remains the number quoted in almost every forecast, buoy report and model output.
Maximum wave height. The largest individual wave in the record. In a typical sea the highest wave is roughly 1.6 to 2 times the significant wave height, and individual outliers can exceed that.
Period. Two values are usually given: the peak period Tp, which carries most of the energy, and the mean zero-crossing period. Period tells you whether the sea is short and steep or long and powerful, and it changes how a hull, a mooring or an autonomous vehicle behaves.
Direction. Both the direction waves travel from and, for a directional buoy, the spread around it. Direction spread matters: a narrow swell is cleaner and more predictable than a wide, confused wind sea of the same height.
Wind speed and direction. The forcing term. Steady wind produces a steady sea; a shifting wind leaves confused remnants from several directions, which is often rougher to work in than the numbers suggest.
Swell. Recorded separately, with its own height, period and origin. Swell is the part of the sea state you cannot control by changing course.
Sea temperature. Included in many operational reports because it affects immersion, air-separator performance on small craft, and the growth of certain biological fouling.
All of these are computed over a stationarity window of roughly 15 to 30 minutes. Longer windows average away real changes in wind; shorter ones give unstable statistics.
What Is Sea State and How Is It Measured in Practice?
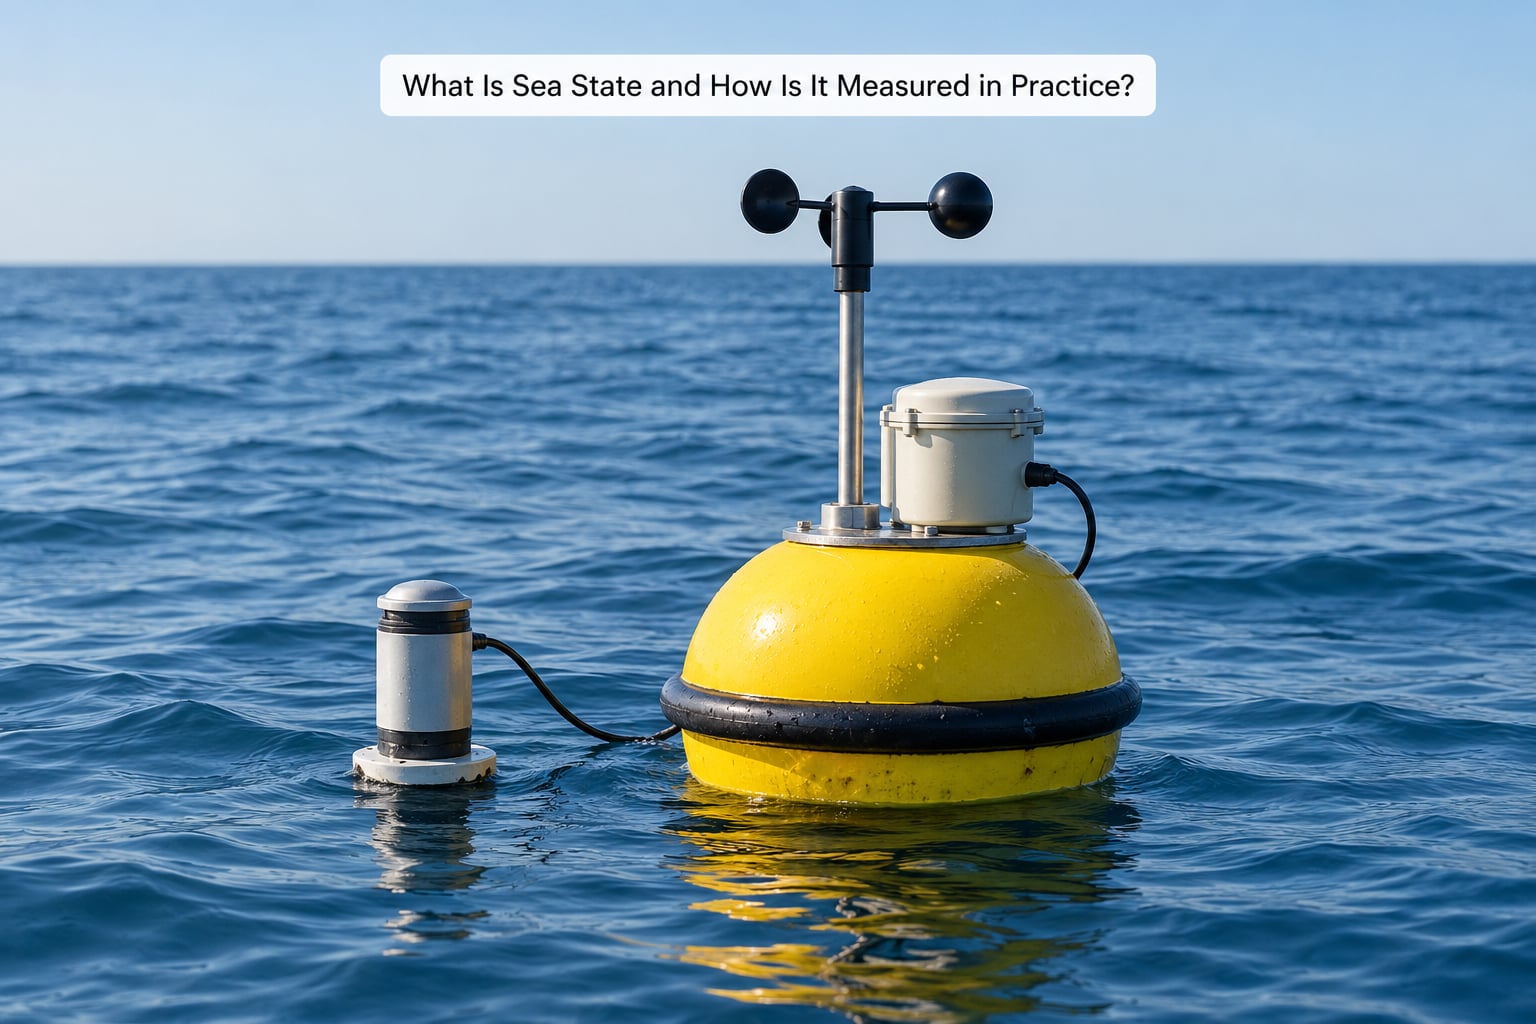
Five methods cover almost all sea-state measurement, and real deployments combine them. Buoys and radar give point accuracy, satellites give coverage, models fill the gaps, and a trained observer on deck keeps the final check.
| Method | What it measures | Coverage | Cadence | Main limitation |
|---|---|---|---|---|
| Visual estimation | Height, period, direction, character by eye | Anywhere with line of sight | Continuous | Observer bias; unusable at night or low visibility |
| Wave buoy | Full surface elevation record, spectra and direction | One point | Seconds to minutes, reported hourly | Mooring motion, biofouling, survivability in severe weather |
| Wave radar | Surface elevation over a sector | Coastal, port and offshore installations | High frequency | Short range; blocked by other structures and clutter |
| Satellite remote sensing | Wave height, wind and current fields over wide areas | Ocean-wide | Repeat passes plus along-track sampling | Sea state bias, sampling gaps, limited directional information |
| Numerical wave model | Forecast fields for any point and time | Basin to global | Hourly runs | Accuracy falls with range and with poorly resolved shallow water |
Visual estimation: measuring sea state by eye
Visual estimation is the method most people will actually use. An observer at the bridge wing picks the average of the highest third of waves in the set, counts the interval between crests to estimate period, notes the direction, and assigns a code.
Two habits make it far more accurate. First, judge the sea from a known height, ideally eye level near the bridge wing, because height estimates from a deck are badly biased downward. Second, look for the wave set: a confused surface with waves crossing at several angles usually carries a higher significant height than the eye first assumes.
At night, in fog or in heavy rain, visual estimation stops being viable, which is why operational decisions lean on instruments.
Buoys and radar: measuring sea state from fixed instruments
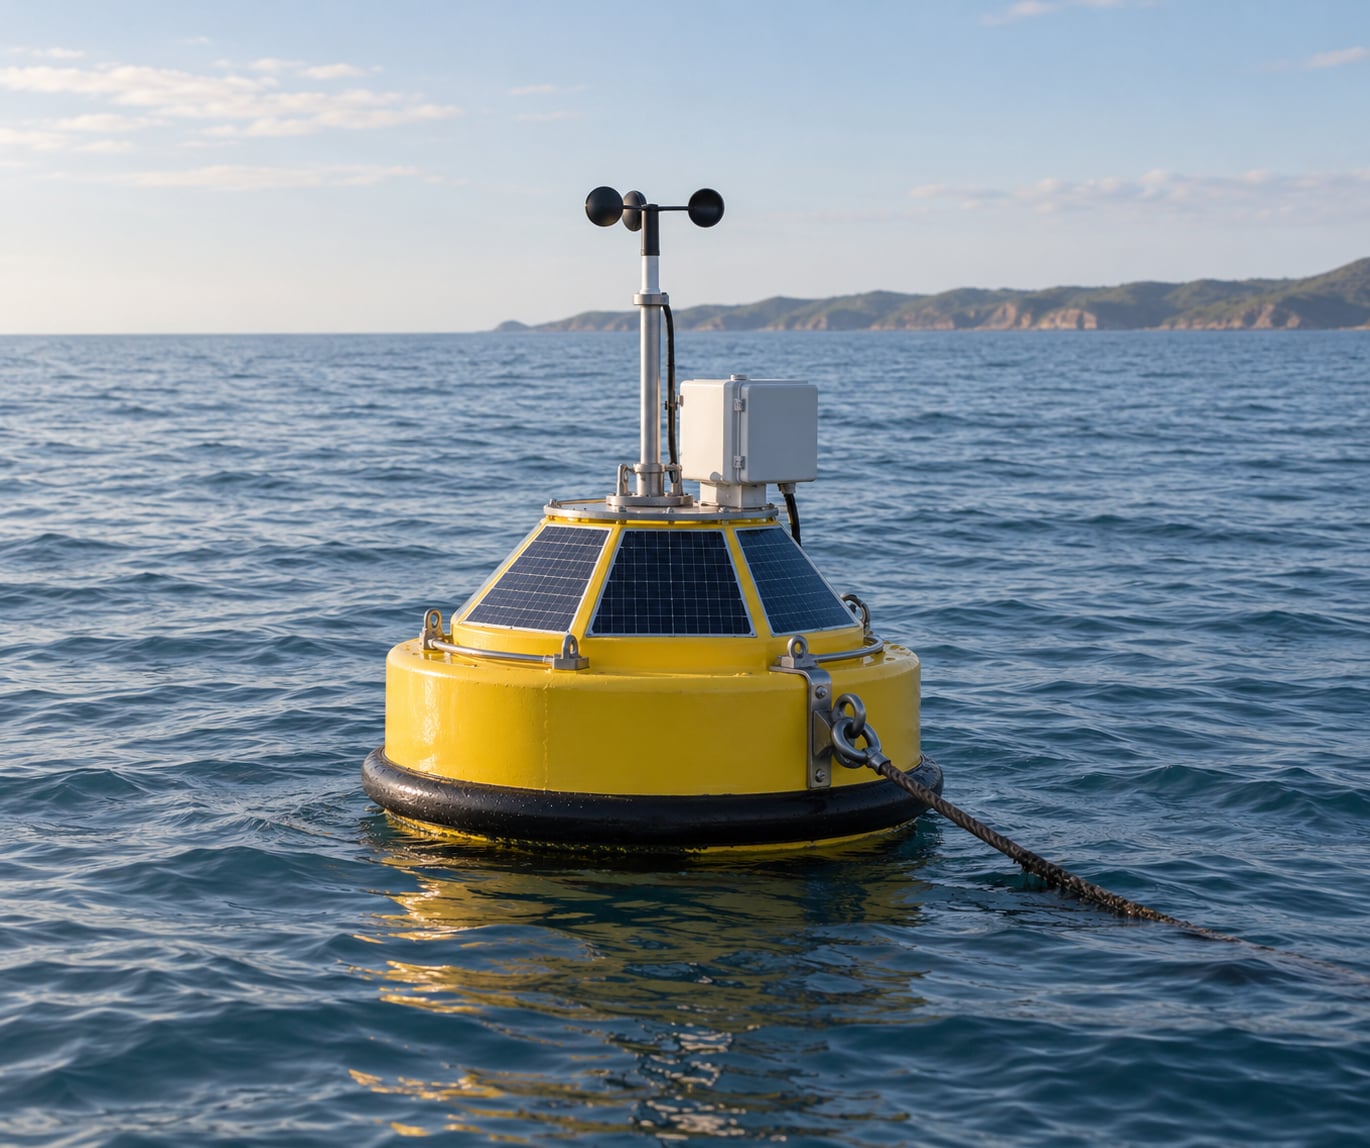
A wave buoy rides at the surface and measures the water surface as it passes. Most carry a heave sensor for vertical position and slope sensors for surface tilt, which together give the directional wave spectrum. Networks such as the NOAA National Data Buoy Center and IMOS publish the derived Hs, Tp and direction routinely, and the buoy remains the reference standard against which other methods are checked.
Wave radar works the same principle from a fixed vantage point. A downward-looking unit measures the distance to the moving surface over a sector, typically a few kilometres, and produces the same spectral parameters. Ports and offshore platforms use it for berth windows and lifting operations.
Onboard GPS motion estimation is a close relative. A vessel with good multi-frequency receivers can estimate its own heave, pitch and roll, then invert that motion for the wave spectrum beneath it. It is free of hardware on the hull, but it needs careful filtering, and it only senses the part of the wave field that couples to the hull.
For a small craft or an ocean drone, in-situ pressure transducers on a hull or keel are the practical route. They read draft changes as the surface passes, which gives a reliable wave height but no direction unless several are fitted.
Satellites and models: what is sea state and how is it measured from orbit
Altimeters measure significant wave height directly, by how far the sea surface moves the satellite up and down as it tracks the ocean. Conventional nadir altimeters sample a narrow track, so they characterise the sea along a line and rely on statistical assumptions between tracks. Wide-swath missions changed that. ESA’s Climate Change Initiative Sea State dataset provides a long global record, and the NASA and CNES Surface Water and Ocean Topography mission returns fine, two-dimensional swaths that resolve individual wave groups. The record wave heights it has documented run to nearly 20 m, well above anything routinely observed by a moored buoy in survivable conditions.
Synthetic aperture radar and scatterometers add wind and current information: SAR imagery shows wave direction and length, and scatterometers measure surface wind speed over the whole ocean. Neither gives a clean wave height on its own, which is why the two are paired in most modern systems.
Wave models complete the picture. They ingest buoy and altimeter data and produce forecast fields, which is exactly what you read before a passage. Their weakness is spatial resolution: a model that cannot resolve a headland, a shoal or a small island will smooth away the very short, steep waves that make a coastal crossing awkward.
One caution applies to all satellite wave heights. Wave fields have more small waves than long ones, and a satellite cannot distinguish every one of them. This under-sampling, known as sea state bias, means altimeter heights run slightly low relative to a good in-situ measurement and are corrected statistically rather than measured directly.
Why Does Sea State Matter for Boats and Marine Robots?
Sea state is not an academic description. It is the variable that decides whether a boat leaves, a lift goes ahead, a berth opens, or an unmanned vessel is allowed out of the water.
For navigation and passage planning, the useful reading is the combination. Period matters more than height for small craft, because a 1.5 m short-period chop can stop an open boat dead while a 3 m long-period swell is rideable if the boat is pointing sensibly. A swell crossing a wind sea at an angle creates a confused surface, which is where small craft actually lose their stability.
Motion loads feed straight into structure. Hull loading, slamming, green water on deck and mooring line loads all scale with height and steepness, and marine engineers handle long-term design through extreme value distributions built on return periods: the 1-in-100-year and 1-in-1000-year conditions that a structure or vessel class must survive.
Sensors drift out of calibration when the platform moves. An IMU, a GNSS receiver or an acoustic sensor mounted on a hull in a seaway sees motion, not water. Sea-state data is used to reject contaminated samples and to describe the environment a measurement was taken in, which is why it belongs in the log alongside the measurement itself.
Power draw rises with conditions. Every stroke of a wave or a heave cycle costs energy, and thrusters working to hold station in a beam sea can dominate a mission’s power budget. That matters for ocean drones, which have no engine room to refuel them.
Comms and control get harder too. Antenna motion, cable and tether loads, and recovery at sea all degrade as the sea state climbs. Most operators set operating limits from measured data rather than a guess: launch below a defined Hs and period, hold position below a defined wind force, and abort when the surface slope statistics indicate breaking waves.
For field testing, this cuts both ways. A moderate sea is an excellent natural test rig for a hull, mooring or sensor package, and I have found rougher water more informative than calm. But test results only mean something once they are reported with the sea state and the measurement duration attached.
Worth keeping separate: sea state is not sea level, tide or current. Sea level is the height of the water surface against a land reference, and tides are the long-period rise and fall on top of it. They change depth and can set up a hazardous bar condition on an otherwise calm day, and no sea state code will warn you about a tide that leaves you aground.
Frequently Asked Questions
Is sea state the same as wave height?
No. Sea state is the whole condition of the surface, described by wave height, period, direction, spectrum, wind and swell together. Wave height is one input. Two locations can share a sea state code with completely different periods, and the one with the shorter, steeper waves will be far harder to work in.
How high can waves become in each sea state?
Each code covers a band, not a number. Code 3 covers about 0.5 to 1.25 m, code 4 covers 1.25 to 2.5 m, code 5 covers 2.5 to 4 m, and code 9 starts at 14 m with no upper bound. Individual waves inside a band routinely exceed its upper limit, so treat the range as the average sea, not a maximum.
What is significant wave height, and why is it used?
Significant wave height, Hs, is the mean crest-to-trough height of the highest third of waves in a record. It is used because it matches what a trained observer calls the average of the big waves, and because it can be computed identically from a buoy, a radar, a satellite or a model. Typical maxima run 1.6 to 2 times Hs.
Can sea state be measured without going offshore?
Yes, and for many decisions that is the sensible route. Coastal wave radar, harbour monitoring stations and satellite altimetry all report wave height and period without anyone going to sea. Visual estimation from shore works in daylight and reasonable visibility. Full directional detail still needs a directional buoy or a model, since neither radar nor a nadir altimeter resolves direction on its own.
What is the difference between sea and swell?
Wind sea is short, steep and irregular, raised by local wind, with a period of a few seconds and a wavelength close to the local depth limit. Swell is long, regular and smooth, generated far away and able to travel thousands of kilometres. A Douglas report codes them separately because the same total height can feel very different depending on the mix.
How do sea-state forecasts affect sailing robots?
Forecasts set operating limits. Operators compare forecast Hs, peak period, direction and wind against the limits written into the vehicle’s launch and recovery procedures. Short periods make station keeping expensive in power, crossing swell makes a wide spread in direction, and rising wind force usually triggers retrieval before the wave height does.
Conclusion
The first practical step is to stop reading the sea state number on its own. Take the height, the period, the direction and the wind together, and the number turns into something you can act on. A 2 m short-period chop and a 2 m groundswell are the same code and two different decisions.
Then match the tool to the job. A buoy or radar gives you an accurate number at one point, a satellite gives you the field around it, a model tells you what it will do in twelve hours, and your own eyes on the water are the check none of them replace.