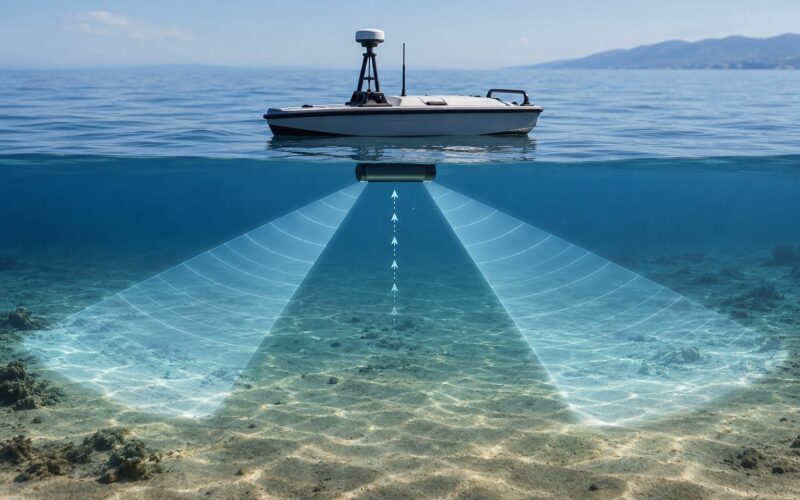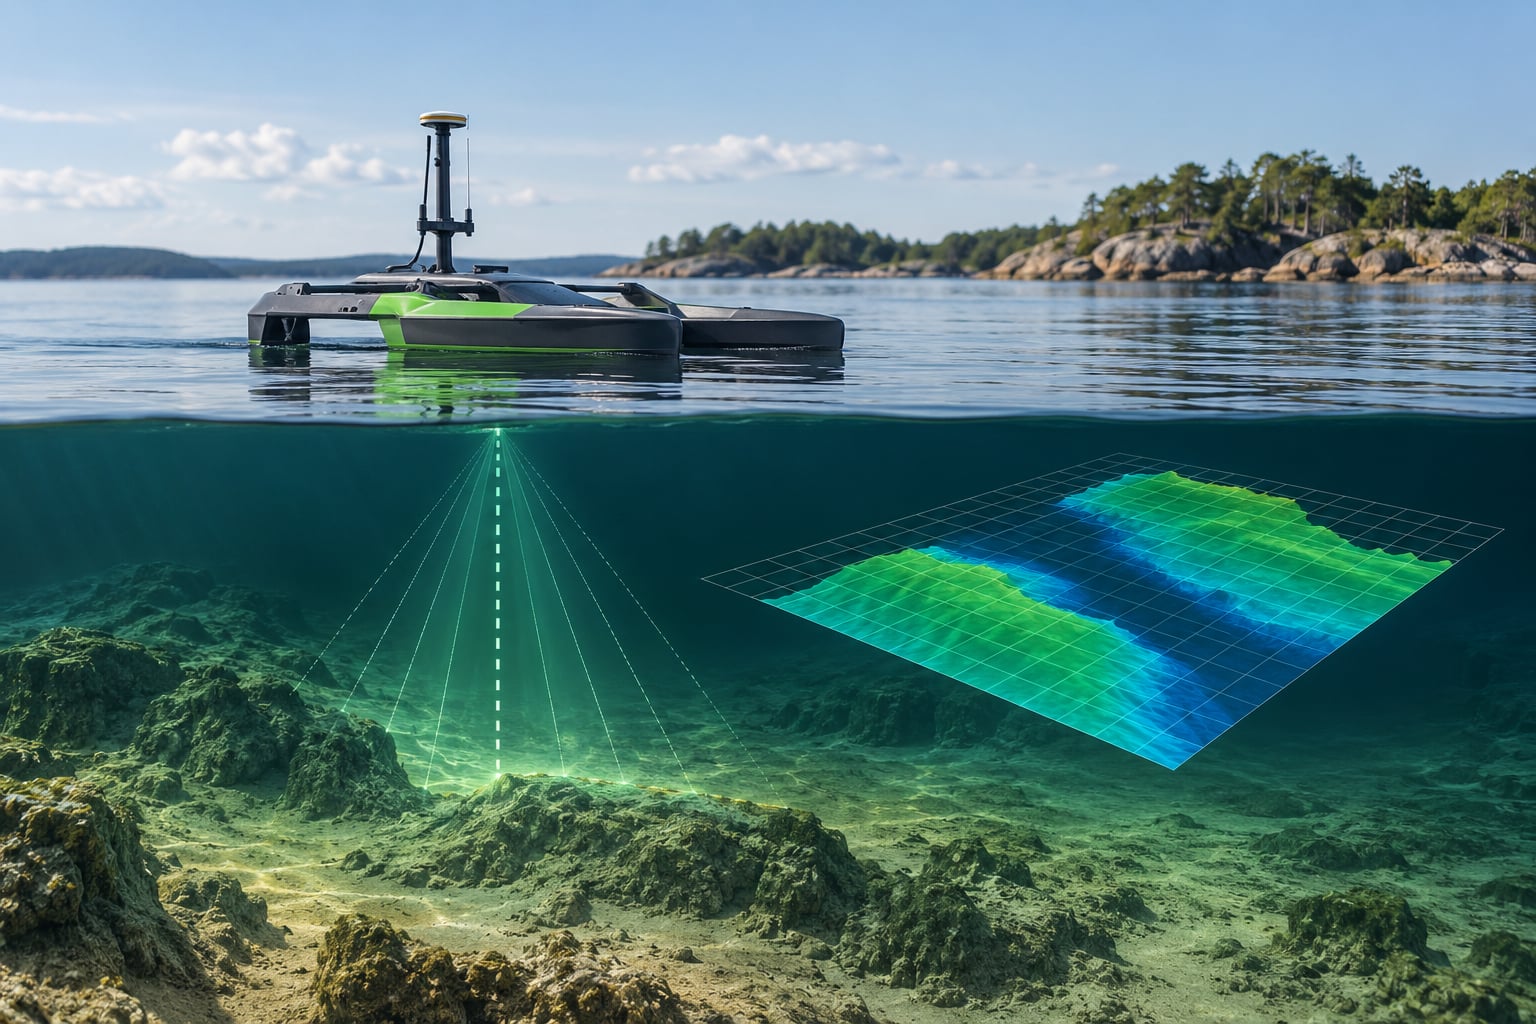
Bathymetric mapping works by bouncing a signal off the seabed, timing how long the echo takes to come back, and pairing that distance with the platform’s position to build a depth surface. Whether the signal is sound, a green laser or a satellite’s view of water colour, the chain is the same: measure, locate, correct, interpolate. That last step is where most of the actual work happens, and where a raw pile of numbers becomes a map you can trust.
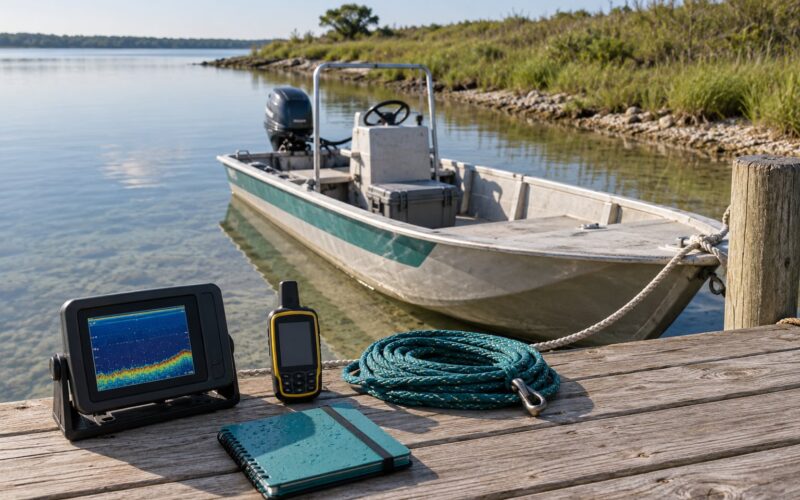
I’m going to walk the whole chain, from one ping to a finished grid, then compare the instruments and the error sources. Nothing here needs a survey vessel: the same ideas apply to a pond you map with a small remote-controlled boat.
Table of Contents
- What Is Bathymetric Mapping?
- How Bathymetric Mapping Works From Sound to Seabed Map
- Which Instruments Are Used to Measure the Seafloor?
- What Happens During a Bathymetric Survey?
- How Are Depth Measurements Turned Into a Map?
- How Do Tide, Water Conditions, and Motion Affect Accuracy?
- How Accurate Can Bathymetric Mapping Be?
- How Does Bathymetry Help Marine Robots and Ocean Research?
- Frequently Asked Questions
- Conclusion
What Is Bathymetric Mapping?
Bathymetry is the measurement and mapping of depth beneath a water surface: seafloor, lakebed, riverbed, reservoir floor or dredge pond. Bathymetric mapping is the process of collecting those depth measurements across an area and turning them into a plan view with contours, a colour-shaded depth surface, or a full 3D terrain model.
It is worth being precise about what the data actually is, because several different things get called bathymetry.
- Measured depth soundings are discrete points. Each one is a single depth reading at a single moment, with a timestamp and a position. This is the raw truth of a survey.
- Gridded bathymetry is the same points arranged into a regular raster of cells, with values between the points estimated by interpolation.
- General ocean-floor models such as global grids are compiled from scattered surveys plus satellite-derived estimates. They are useful for orientation and terrible for anything that needs centimetres.
- Water-surface measurements such as wave height or tide level are not bathymetry. They are inputs to it, used to correct depth.
- Underwater imagery from cameras or side-scan sonar shows what the bed looks like, not how deep it is. It gets combined with bathymetry rather than replacing it.
The distinction matters most when you compare sources. A number in a chart, a number in a global grid and a number from your own survey can all be called “depth” and still differ by a metre or more because they are referenced to different vertical datums.
How Bathymetric Mapping Works From Sound to Seabed Map
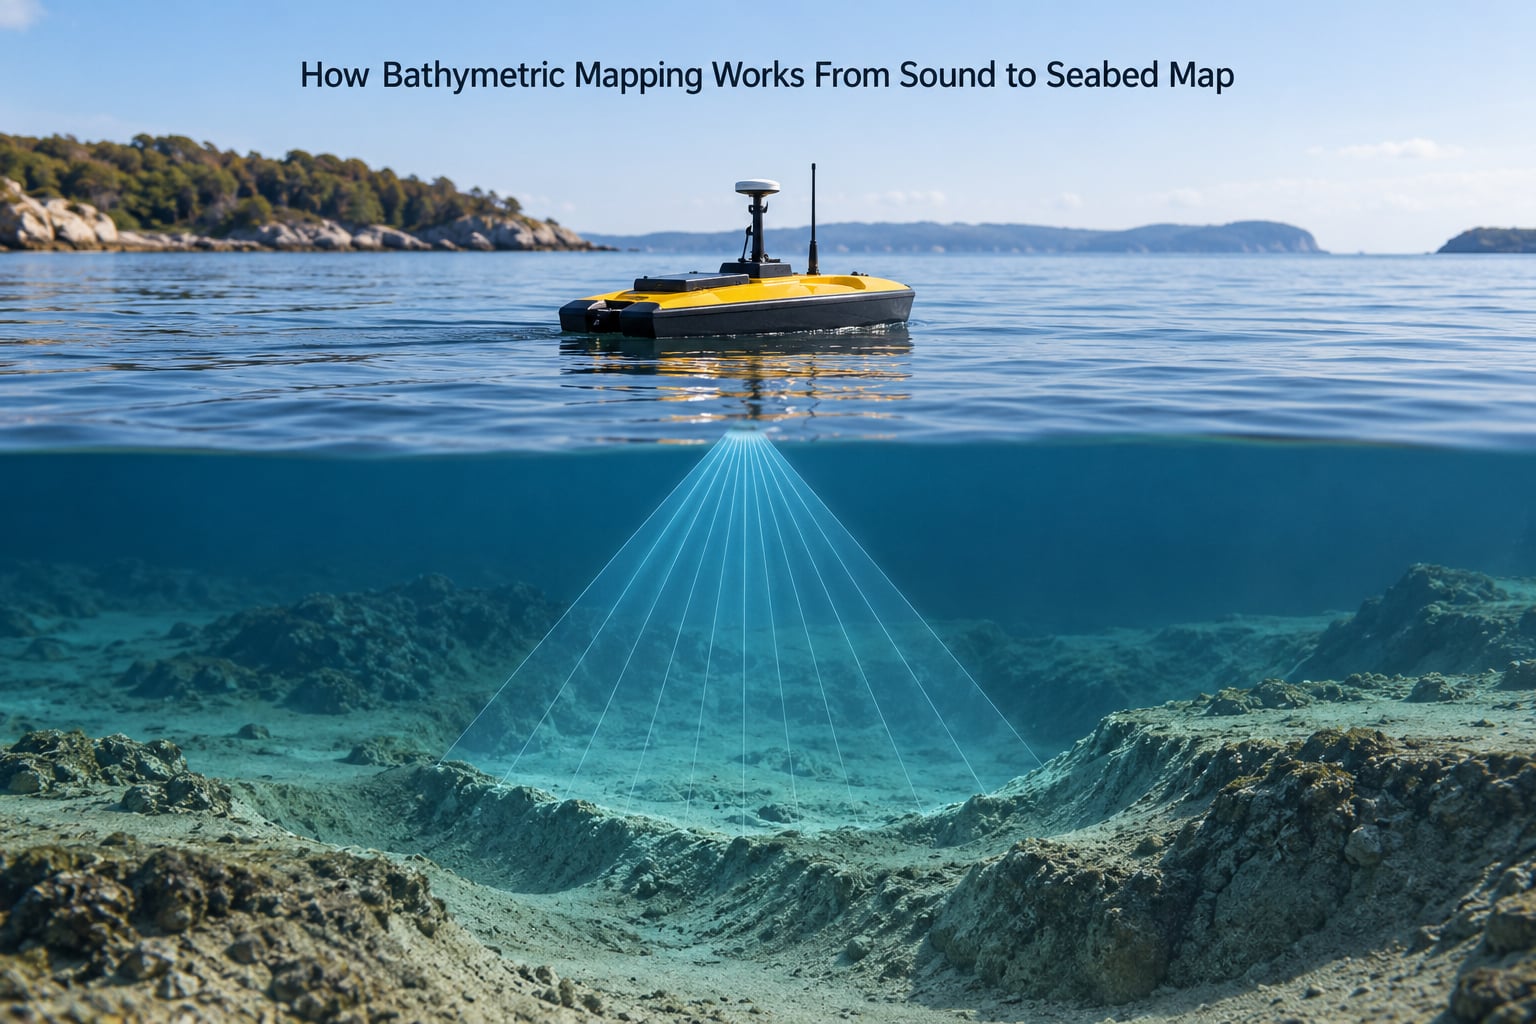
A single echo gives you one depth. A useful map needs tens of thousands of them, each tied to a place, a time and a set of corrections. Here is the chain in the order it happens.
| Step | What happens | What the system produces |
|---|---|---|
| 1. Emit | The transducer fires a short acoustic pulse at a known frequency, or a lidar fires a laser pulse at a known wavelength. | An outgoing signal with a start timestamp |
| 2. Propagate | The signal travels through the water column, slowing and bending as temperature, salinity and pressure change with depth. | A real path that is rarely a straight line |
| 3. Detect | Energy scatters off the bed and returns. Some of it returns from the water surface or from a school of fish first. | A return, plus its arrival time and strength |
| 4. Convert time to depth | Travel time is halved for the one-way leg and multiplied by the local sound speed or light speed. | A depth below the transducer |
| 5. Locate | A GNSS receiver gives the platform’s horizontal position at the same instant. | An easting and northing for the sounding |
| 6. Correct | Sound speed, tide, heave, roll and draft offsets are applied to put the depth onto a chosen datum. | A corrected depth in real-world coordinates |
| 7. Grid | Corrected soundings are filtered and interpolated into a regular cell grid, typically by kriging or a TIN. | A digital elevation model of the bed |
| 8. Render | The grid is drawn as contours, colour ramps or a 3D surface, often with hillshade and backscatter layers. | A map or terrain model |
The conversion in step 4 is the one people find surprising. Depth is not measured directly; it is inferred from time. Try it with round numbers: a pulse leaves the transducer, and the echo returns 0.4 seconds later. Half of that is 0.2 seconds one way. Multiply by roughly 1500 metres per second, the typical speed of sound in seawater, and you get about 300 metres of round-trip distance, so about 300 metres down. One assumption in that arithmetic, the 1500, is a guess until you measure it, and it is where most naive surveys go wrong.
Step 7 is where the character of the map is decided. Interpolation does not create knowledge; it draws a smooth surface between points you actually measured. Where soundings are dense, the grid is close to the truth. Where they are sparse, the grid is mostly the algorithm’s opinion, which is why point density matters so much when you judge a survey.
Which Instruments Are Used to Measure the Seafloor?
Every depth instrument falls into one of three families: sound, laser, or inferred-from-optics. Within sound there is a big split between measuring one depth per ping and measuring a whole swath at once.
| Instrument | Principle | Coverage per pass | Typical resolution | Main limitation |
|---|---|---|---|---|
| Single-beam echosounder | One narrow beam straight down; returns one depth per ping | A line, with gaps between lines | Excellent along track, poor between lines | Seabed between survey lines is inferred, not measured |
| Multibeam echosounder | An array of narrow beams across the keel; each beam is a separate depth | A full swath, typically several times the water depth in width | Cell sizes from centimetres in shallow water to decimetres offshore | Cost, and sensitivity to sound-speed error that curves the outer beams |
| Side-scan sonar | Wide beams to port and starboard; records echo strength, not always depth | A wide image strip alongside the track | High along track, low across track | Distortion where the beam meets the bed at a slant range |
| Bathymetric lidar | A green laser pulse; two-way flight time gives range | Overlapping strips from an aircraft | Decimetre to sub-metre, degrading with turbidity | Only reaches clear, shallow, calm water |
| Radar or pressure gauges | Water-surface level, not the bed | A point time series | Millimetres of level | Cannot see the seabed at all; a correction input only |
| Satellite-derived bathymetry | Optical depth retrieval: the water colour itself encodes the depth | Regional, from repeated imagery | Usually metres to tens of metres | Fails on turbid water, clouds and breaking waves |
For makers, the practical split is short. Single-beam is cheap, forgiving and gives you a depth profile that is only as good as your line spacing. Multibeam gives complete coverage between lines, which matters the moment your grid has to look even, but it punishes sloppy sound-speed handling far harder.
What Happens During a Bathymetric Survey?
A survey is a sequence of decisions made before the boat ever leaves the dock. The order below is roughly how a small field survey runs, and most of it applies whether the platform is a skiff, an autonomous surface vessel or a crewed survey boat.
- Plan the grid. Decide what question the map answers and what resolution it needs. Line spacing sets the gap between soundings, and overlap between passes removes nadir gaps and lets neighbouring swaths agree as a quality check.
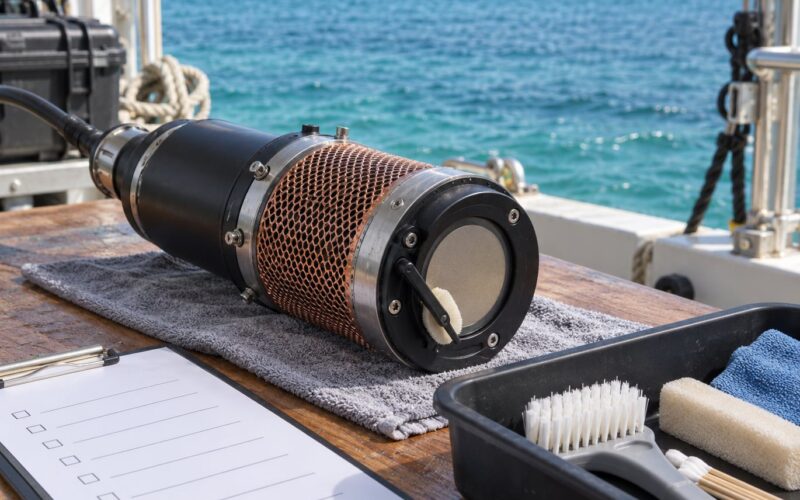
- Mount the transducer. Fix it where it stays wet at all times and sits clear of propellers, bubbles and turbulence. A transducer that lifts clear of the water on a wave is the most common cause of lost pings.
- Set the draft offset. Measure how far the transducer face sits below the waterline and enter it. Many consumer units need a depth-below-transducer setting, and if that number is wrong, every reading inherits the error.
- Calibrate. Run over a known feature at known depth, or compare against a charted spot, and adjust until the readings match. On shallow water, roll and heave are the two parameters worth fussing over.
- Navigate the lines. Run each line straight and at a steady speed. Slow speeds crowd soundings together and make filtering harder; high speeds smear the along-track footprint and blur steep features.
- Collect the pings. Watch the live screen rather than the transit. Lost bottom returns, spikes, jumps to the surface and constant dropouts all show up before you get back to shore.
- Check quality in the field. Compare overlapping passes. If two passes over the same ground disagree by more than the depth, you have a calibration, offset or timing problem to sort out while the boat is still afloat.
- Back up and process. Copy the raw file off before the battery goes, because raw soundings cannot be recreated later, only repaired.
How Are Depth Measurements Turned Into a Map?
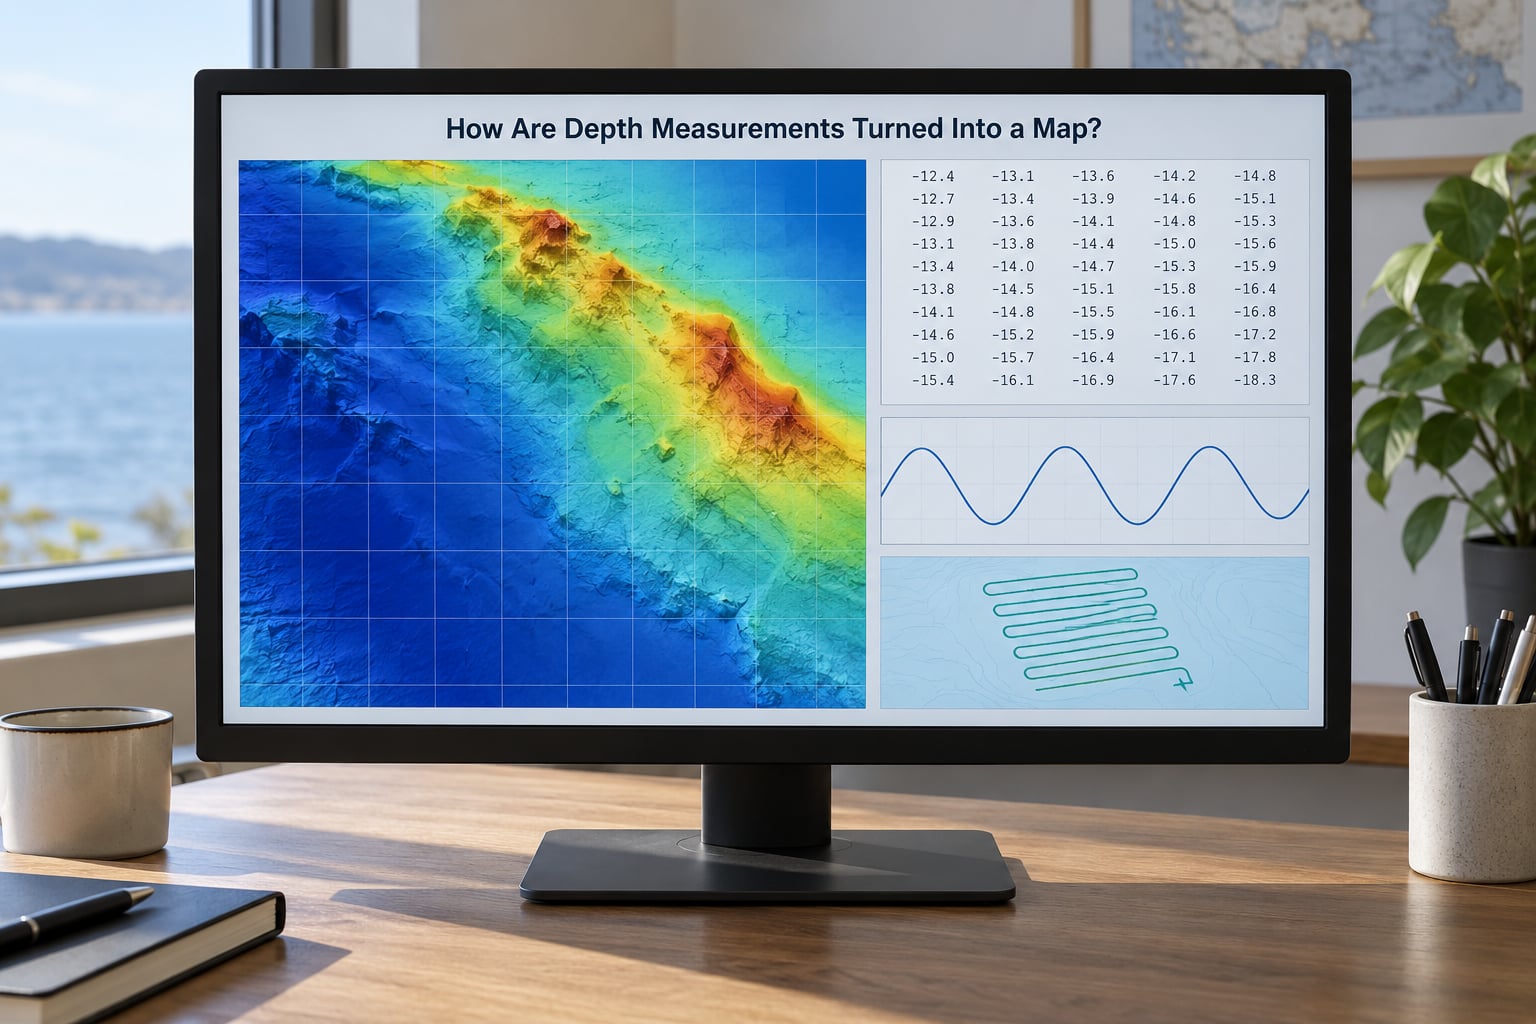
A sounding leaves the sounder as depth below transducer, with a time and a position attached. Turning that into a map takes a defined sequence, and skipping a step is why two surveys of the same pond can disagree.
First comes georeferencing. Each ping becomes an X, Y and Z in a coordinate system, usually a state plane grid or UTM zone, with the horizontal position supplied by the GNSS antenna. Then the corrections run, roughly in this order:
- Sound speed. A measured profile of speed versus depth replaces the guessed constant, and ray tracing re-derives the true path and slant range of each beam. This is what stops outer swath beams from being plotted too far out.
- Draft and mounting offset. The transducer’s depth below the waterline is added or subtracted consistently.
- Heave and roll. Motion sensors, or an IMU, measure how the hull moved so the depth is attached to the position the beam actually left from.
- Tide and water level. Each sounding’s timestamp is matched to a tide curve and reduced onto a fixed vertical datum, so the same patch of bed does not appear to move between survey days.
- Outlier filtering. Spikes, soundings in the water column and points off the seabed trend are removed before interpolation.
Then comes the interpolation, and this is where you choose a method. Kriging and other weighted statistical methods produce the smooth raster most people picture when they imagine a DEM. A triangulated irregular network, or TIN, keeps the actual measured points and interpolates linearly between them, so no value is invented far from a sounding, but the surface comes out faceted. Bathymetry software does this step, whether it is a free open-source processing stack, a commercial hydrographic suite or a general GIS tool, and the packages differ mostly in how much control they hand you over the output.
Rendering is the last step and the least technical. Depth ramps from shallow to deep, contours are traced at regular intervals, hillshade gives the surface some shape, and a 3D view turns the grid into something you can rotate. Backscatter, the strength of the returned echo, gets laid over the same grid and hints at what the bed is made of: soft mud returns weakly, rock and gravel return strongly.
A worked example makes the pipeline concrete. Suppose a single-beam sounder records a ping whose round-trip time is 0.0133 seconds in 1500 m/s water, 10 milliseconds of it spent on the return. The one-way time is 6.65 milliseconds, which is about 10 metres, giving a depth of roughly 10 metres below the transducer. With a 0.4 metre draft, the bed sits 10.4 metres below the waterline. On a 0.8 metre tide, the same bed reduces to 9.6 metres below chart datum. Without a tide correction, that 0.8 metre would have gone straight into the map as a slope in the bed.
How Do Tide, Water Conditions, and Motion Affect Accuracy?
Most depth error is not the sensor. It is everything around the sensor, and the fixes are mostly procedural.
Where bathymetric mapping runs into tide and changing water level
A river gauge, a satellite-derived water level or a pressure gauge fixes the height of the surface at every sounding. Reservoir and lake levels swing far more than most people expect between visits, which is exactly why surveys are dated and referenced to a datum rather than compared raw.
Sound speed and ray bending
Sound travels at about 1450 m/s in cold fresh water and closer to 1550 m/s in warm salty water, and it changes with depth through a thermocline. If you assume a constant speed, the depth is wrong. If the profile has a sharp gradient, the ray physically bends, and the straight-line assumption puts outer beams in the wrong place entirely. Multibeam surveys are far more exposed to this than single-beam ones.
Vessel motion
Heave moves the transducer up and down, roll tilts the beams sideways, and pitch smears along-track. An attitude sensor plus a good mounting solves most of it. At survey speeds of a few knots, motion is manageable with filtering; run the same lines at double speed and the artefacts come back.
Position
This is the constraint most people underestimate. A consumer GNSS receiver is good to a few metres, so a survey on that hardware is horizontally limited to a few metres no matter how good the sonar is. Every sounding has the platform’s position error added to it, and two passes over the same spot can differ purely because the antenna was in a different place.
Sensor offset and mounting
Transducer draft, lever arm between antenna and transducer, and the difference between the transducer face and the hull all bias results if measured carelessly. Measure the geometry with a tape, write it down, and put it in the setup file.
Multipath and feature detection
Strong reflectors such as a hull, a piling or a dense school of fish can return an echo ahead of the real seabed, giving a shallow reading. This shows up as scattered points that are too shallow. In shallow water, bubbles and aeration from a propeller produce the opposite: sudden bottom loss.
Point density and sampling
Along-track spacing, line spacing and beam footprint all decide how much of the grid is measured rather than interpolated. Where density collapses, the map turns confident and wrong.
How Accurate Can Bathymetric Mapping Be?
Bathymetric mapping accuracy is best described as a vertical figure and a horizontal figure, not one number. A survey can have vertical accuracy well inside 1 percent of water depth while being horizontally several metres out, and on a shallow pond the horizontal error can matter more than the vertical.
| Error source | Typical magnitude | How it is reduced |
|---|---|---|
| Sound speed | Decimetres to per cent of depth, worse on the outer beams | Measured profile, ray tracing, daily calibration |
| GNSS position | 1 to 3 m consumer; decimetres with correction | RTK or equivalent correction, fixed antenna geometry |
| Tide and datum | Centimetres in tideless lakes; decimetres to a metre on an exposed coast | Gauge or satellite water level, fixed vertical datum |
| Heave, roll and pitch | Decimetres in calm water, more in a seaway | Attitude sensor, filtering, slower lines |
| Draft offset | Centimetres if measured, tens of centimetres if guessed | Measure and record the mounting geometry |
| Point density | Unbounded in unsurveyed gaps | Tighter line spacing, more overlap |
These are representative figures from normal working practice, not guarantees. Published field work on small water bodies has shown repeat surveys of the same fixed transect agreeing within about 5 percent, roughly 5 cm, with repeat departures of only a couple of centimetres, which is a fair benchmark for a well-set-up small system. Repeatability is not the same as accuracy: a survey can be perfectly repeatable and consistently wrong by half a metre if its draft offset or datum is wrong.
For professional work, the IHO S-44 standard defines survey quality orders with explicit vertical and horizontal uncertainty limits and required feature detection. It is a useful yardstick to check a survey against, and worth reading alongside any dataset you did not collect yourself.
How Does Bathymetry Help Marine Robots and Ocean Research?
Once the depth data exists, it stops being a map and starts being a measurement other things are built on.
- Route planning and obstacle avoidance. A USV or AUV that carries its own echosounder can build a bathymetric map of an area first, then plan a path across it. Field teams use the same idea by surveying before a mission rather than discovering a boulder at depth.
- Infrastructure scour. Bridge piers, culverts and outfalls fail when material is removed around them. Repeat bathymetry shows the hole forming and, in a dredging or armouring job, shows whether the repair worked.
- Dredging volumes. Surveying before and after a dredging pass turns “it looks deeper” into a cut volume you can invoice against.
- Habitat and environmental monitoring. Depth and slope drive where plants, coral and sediment communities sit, so repeat bathymetry shows both physical change and its effect on habitat.
- Flood and hydraulic modelling. Flood models need a channel and floodplain surface. Coarse public grids are often not enough once water starts moving over a surface, which is a common reason practitioners run their own survey.
- Sediment transport studies. Differencing two surveys of the same reach gives a volume of erosion or deposition, which is how post-fire river recovery and river-reset monitoring programmes get their numbers.
- Rover and docking planning. Working underwater, a robot needs to know its altitude above the bed to hover, avoid sediment plumes and settle onto a landing point.
The value comes from pairing depth with something else. A robot that fuses its echosounder with bottom discrimination and optical imagery can separate soft sediment from rock; one that adds water-quality sensors can correlate turbidity with depth. Bathymetry supplies the geometry, and the other payloads supply the meaning.
Frequently Asked Questions
Does sonar actually map the shape of the seafloor?
Yes. A sonar sounder sends a sound pulse to the bed and measures the round-trip time. Multiplying half that time by the speed of sound gives the distance, which becomes a depth below the transducer. Repeating that thousands of times while the platform moves, and pairing each reading with its position, builds a continuous surface of the bed rather than a set of isolated points.
What is the difference between single-beam and multibeam sonar?
A single-beam echosounder fires one narrow beam straight down and returns one depth per ping, so you only measure the track the boat actually drove. A multibeam echosounder fires a fan of many narrow beams across the vessel and measures depth on each one, covering a full swath in a single pass. Multibeam gives complete coverage between survey lines and higher point density, at higher cost and with more sensitivity to sound-speed error.
What software is used to create a bathymetric map?
The same steps run in everything from free open-source processing tools to commercial hydrographic suites and general GIS packages. Typically the software imports the raw sounding file, applies tide and sound-speed corrections, filters outliers, interpolates soundings onto a regular grid using kriging or a TIN, and exports a raster or vector surface with contours. Consumer sonar logs can also be converted to CSV and gridded in general-purpose GIS software.
Can bathymetric mapping work without GPS positioning?
Technically yes, since the sounder measures depth on its own, but the result is a depth profile with no location attached, which is not a map. For a boat you need position to tie soundings to places. Some systems substitute an inertial or acoustic positioning system for GNSS underwater, where GPS signals cannot reach, but surface and small-vessel work normally relies on GNSS and its accuracy sets the horizontal limit of the survey.
Why might a measured depth differ from a nautical chart?
Three reasons come up first. The datum differs: chart depths are usually reduced to chart datum, a low-water reference, while survey data may be on an ellipsoidal or geoid reference. The chart may simply be old or averaged over a larger area than your survey. And your draft offset or tide reduction may be wrong. This is why a hand-held sounder and a chart routinely disagree by more than the depth itself.
Conclusion
How bathymetric mapping works comes down to four things: a returned signal, a position for each measurement, environmental corrections, and spatial processing that turns points into a surface. Miss any one of them and you have a pile of numbers with a picture on top of it rather than a map.
If you are building this yourself, start small and start honest: a single-beam echosounder, a documented draft offset, straight lines over a test area you can survey twice, and a tide value for every ping. Get those four consistent before worrying about multibeam. This article was checked against current IHO survey standards in October 2026.