A cheap depth sounder will give you a usable chart of a pond, lake or shallow bay if you treat it like a survey rig instead of a toy: log every ping against a GPS fix, calibrate the transducer offset, run parallel lines at a steady speed, and grid the result. That is the whole method behind how to use a cheap depth sounder for mapping, and this guide walks through it end to end.
One caveat up front, because it decides how far you should trust the output. A budget sounder is a single-beam echosounder, not a multibeam one, and its absolute depth depends on an assumed speed of sound. Two to four feet of error is normal in shallow water, and a transducer mounted badly can read six feet in four feet of water. Build it for fishing structure and shallow reconnaissance, never for navigation.
Table of Contents
- What You Need
- Step-by-Step
- Tips for More Reliable Depth Maps
- Frequently Asked Questions
- Can a fish finder make a depth map?
- How accurate is a cheap depth sounder compared to a lead line?
- Is a cheap depth sounder accurate enough to navigate by?
- Do I need to calibrate the transducer offset for shallow water mapping?
- How do I log depth and GPS together on a budget sounder?
- What software turns a depth log into a bathymetric map?
What You Need
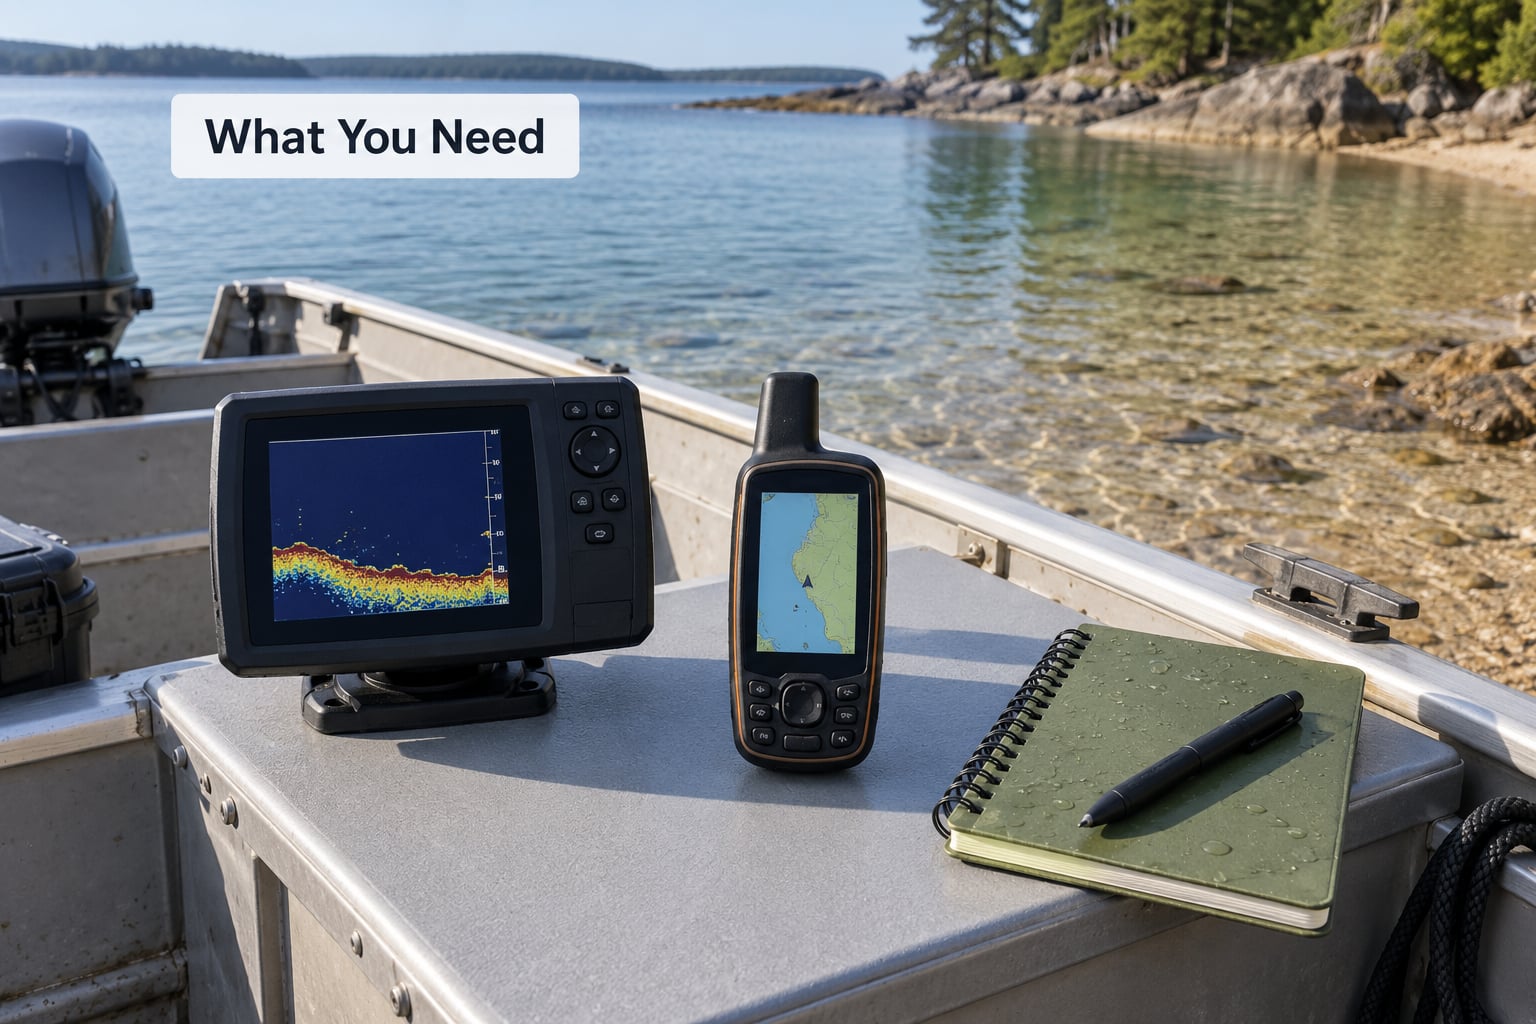
You need four things: a depth sounder, a position source, a way to log both together, and an independent way to check the readings. Everything else is convenience.
The three kinds of affordable sounder
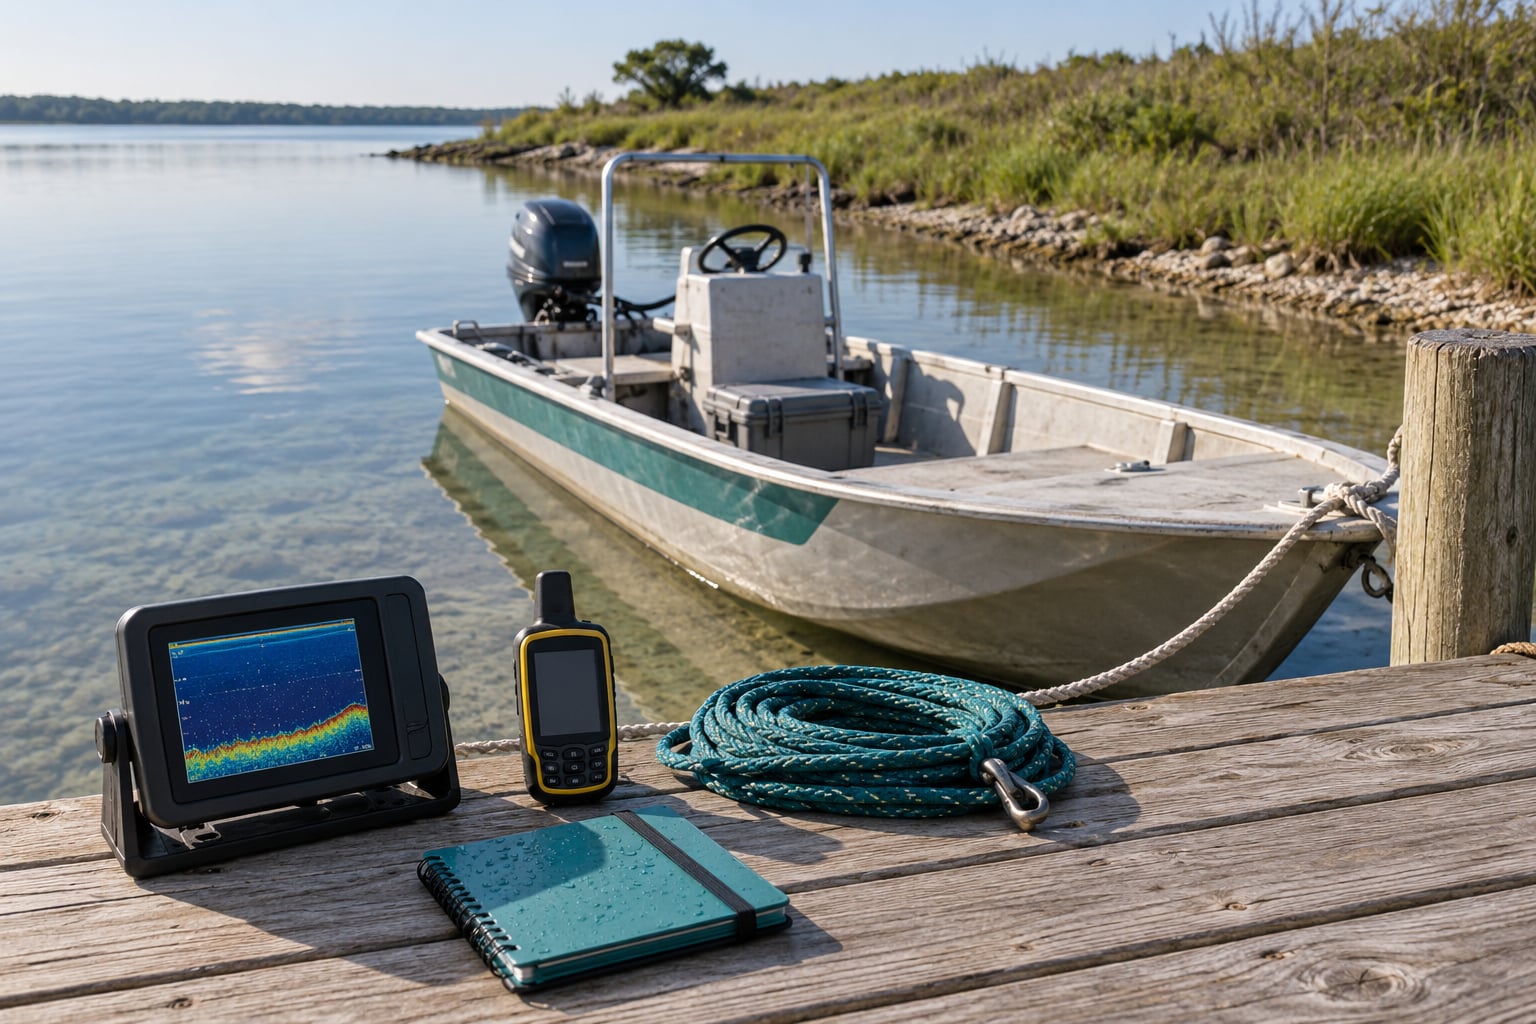
Handheld or cast sonar is the cheapest way in. You aim a weighted transducer from shore, a dock, or a bridge, and it returns a depth to a phone or a small display. Tactical Bassin and countless forum threads use this for finding structure, and the SERC field activity run by Carleton University built an entire bathymetry assignment on cast and tow setups like it.
Wireless transducer plus phone is the smoothest path to a finished map. The Lowrance FishHunter is the unit that course called user-friendly with surprisingly sophisticated output, streaming readings to a phone that draws contours as you go. You get a picture of the lake immediately, which is what most people actually want.
A fish finder with NMEA output is the one that gets you real survey data. It logs depth and position as timestamped sentences you can merge, re-process, and correct later. If your goal is a repeatable map rather than a pretty screen, this is the class to buy.
The supporting kit
- Position source. A handheld GPS or phone with a decent satellite lock, running at a 1 to 5 second logging interval. The phone you photograph with is usually worse at this than a dedicated receiver.
- Mounting materials. A rigid bar or stern mount for a fixed transducer, or a tow line and a float for dragging one behind a kayak or dinghy. Adhesive mounts fail in sun and spray; mechanical clamps hold.
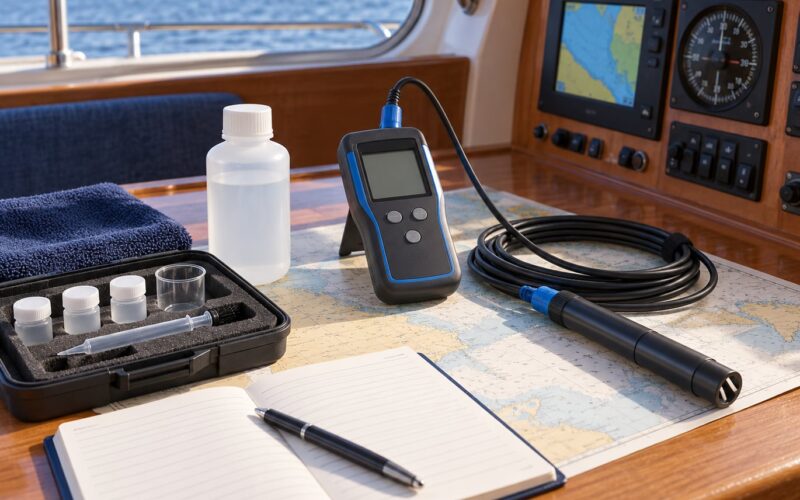
- Calibration reference. A lead line with a marked weight, a known benchmark such as a bridge pier or a dock with a stated depth, or a second boat’s sounder reading the same spot.
- Power protection. An inline fuse, a waterproof case, and a battery you can check with a multimeter. Sudden depth jumps are almost always a voltage sag.
- A logging method. A phone app for casual contour drawing, or NMEA 0183 capture into a log file for anything you intend to re-process. Write your run notes on paper too; you will not remember which pass was the one in the rain.
Step-by-Step
1. Choose a Sounder and Map-Making Method
Pick the method that matches the water and the patience you have. A handheld caster covers a small pond from a dock in an afternoon. A wireless phone setup covers a recreational lake over a weekend with no wiring. A trolling motor mount or a towed transducer on a dinghy covers anything you intend to run navigation routes on.
The Carleton activity gives a useful rough benchmark for how much work a map takes: about ten traverses of tens of meters each before contours mean anything. Below that, what you are looking at is noise dressed up as a map.
2. Check the Site and Survey Route
Walk the shoreline before you launch and note what you cannot see: submerged stumps, rock gardens, drop-offs, current seams near creek mouths, and cable or pipeline crossings. Mark a recovery point you can reach from shore if the engine quits.
Then draw the line pattern on paper. Parallel traverses at a fixed spacing are the default, and they are the only pattern you can grid honestly. Decide the spacing before you start, based on the smallest feature you care about: twice the line spacing roughly bounds how big a feature you will not miss between lines.
Mark any area you will not survey. A wind-funneled narrows or a fast creek crossing gets logged as unsurveyed, not guessed at.
3. Mount and Protect the Transducer
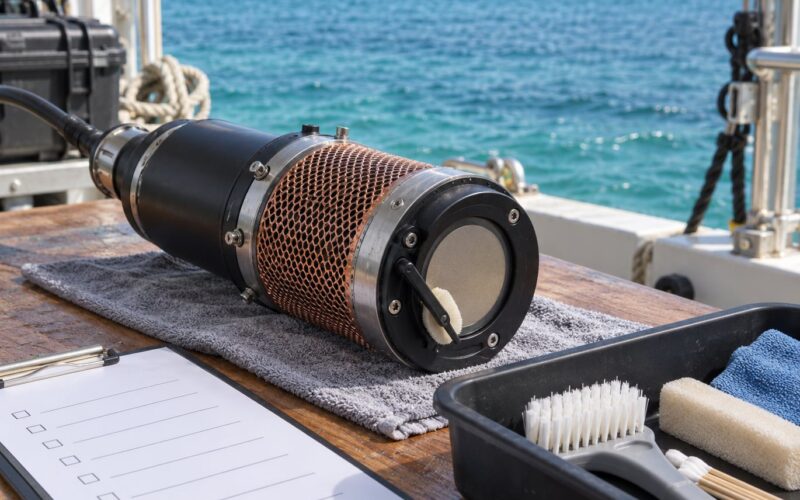
Put the transducer where it sees clean water: free of bubbles, weed, hull shadow, and prop wash. Every one of those produces a false shallow reading or a dropout, and dropout gaps are exactly what the forum crowd complains about on incomplete map lines.
Bubbles are the classic failure. A transducer sitting in aerated water, or mounted just under the surface where the hull planing pulls air past it, will report absurd values on every pass. When a line suddenly reads three feet in eight feet of water, check air first and hardware second.
Secure the cable with strain relief, keep it clear of the prop, and leave the sensor at a steady depth. If you tow, use a weighted float on a short line and hold a consistent depth so the transducer never breaks the surface or digs in.
Then let the unit run for a few minutes before you trust anything. Cold electronics drift as they warm, and a shallow sounder settling into its first minutes is normal.
4. Calibrate the Readings
Calibration here means two things: correcting the transducer offset and checking the sound-speed assumption. Start with the offset, because it is the big one and almost nobody does it.
Measure real depth with a lead line at a spot where the sounder is also reading. If the lead says 4 feet and the unit says 6, set the depth offset so the display reads 4. A trolling motor transducer left at its factory setting can read two feet too deep for years and quietly corrupt every map you ever draw from it, which is why it shows up so often as the one fix nobody has made.
Write the correction down with the date and the spot. It changes when you move the transducer or change the boat’s load, because a boat floats higher or lower with fuel and gear.
Then check at a second depth. Shallow water is forgiving because the total travel time is short, so a 2 percent sound-speed error on a 10 foot bottom is a fifth of a foot. Double the depth and the same error doubles. Two checks at different depths tell you whether your unit drifts with depth, and if it does, note it rather than assuming a single offset fixes everything.
5. Log Depth With Position and Time
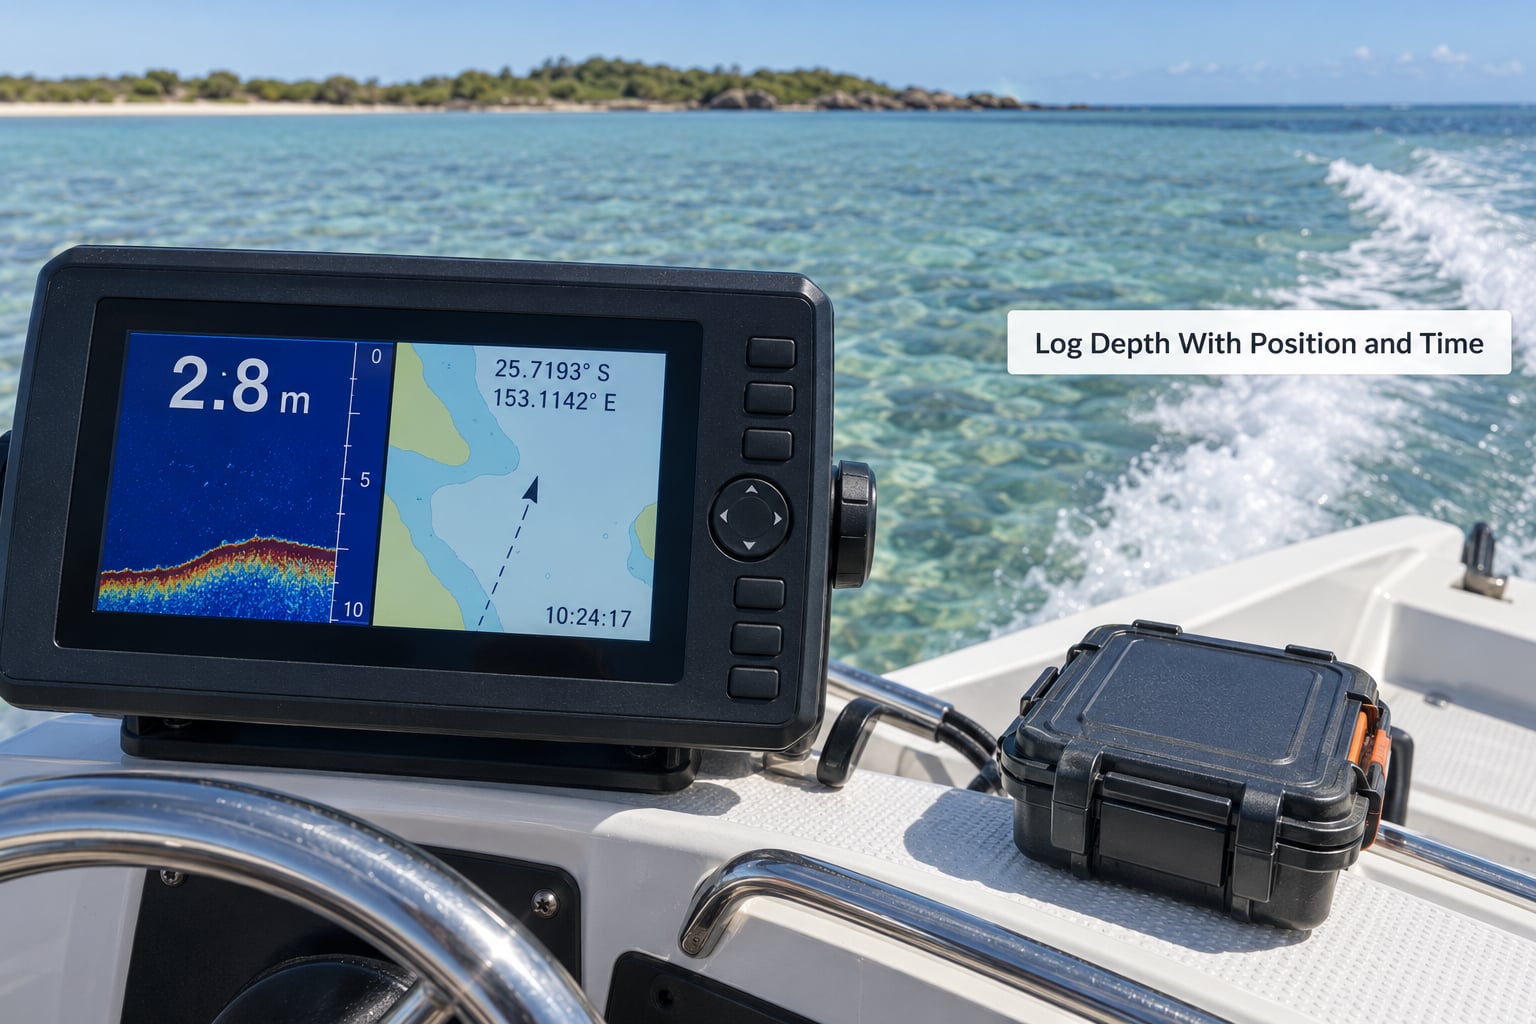
Log depth, position, and time on one record. That single requirement is what separates a map from a list of readings. A depth without a position is trivia.
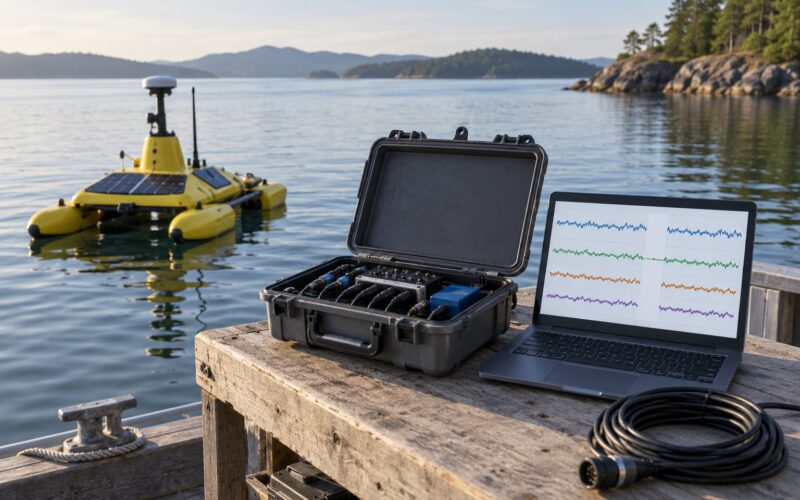
On an NMEA-capable sounder, connect it to whatever is logging and record the sentences directly. The DPT sentence carries depth; the position comes from the GPS receiver; both carry timestamps so they can be paired afterwards. Logging on a fixed interval, say every two seconds, gives you a predictable row of data even when the sounder’s ping rate changes with depth.
On a phone setup, let the app record the track and let it geotag the soundings. Just keep a written log of water conditions. When a line looks strange later, knowing that a warm front blew through and the water went from 12 to 16 degrees explains more than any amount of staring at the data.
Keep the sensor powered consistently for the whole run. A unit that reboots mid-transect gives you two half-lines and a gap you cannot fill without going back out.
6. Survey the Area and Test the Data
Run your lines at a steady, modest speed. The rule people forget is under-sampling: if your sounder pings once per second and you cover 10 feet between pings, your spacing along the line is already coarser than most shallow features you care about. Slower is denser, and dense is the difference between a map and a scatter of dots.
Repeat the calibration spot once mid-survey. If the offset has drifted, you now know it drifted during the run rather than afterwards, and you can flag the affected lines.
Watch for the two signature problems. Outliers, where one reading is wildly wrong among good neighbours, are almost always a bubble strike or a shallow feature your transducer clipped. Gaps, where a whole stretch has no data, are usually aeration, weed, or a battery voltage sag.
These are the error sources that decide whether you trust the finished map:
| Source | Direction | Rough magnitude | Correction |
|---|---|---|---|
| Uncalibrated transducer offset | Reads deep or shallow | 1 to 2 feet in shallow water | Lead-line check and offset setting |
| Speed of sound error from water temperature | Usually reads deep | Under a foot shallow, a few feet deep | Note the temperature, repeat at depth |
| Water level and tide | Whole map shifts | Feet, depending on range | Record water level with every run |
| Air bubbles on the face | False shallow reading | Any depth | Re-mount below the aerated layer |
| Speed too high | Under-sampling | Missed features | Slow down, raise the ping rate |
| Voltage sag | Dropouts | Data gaps | Fuse, check battery, run power |
Before you trust any of it, compare a few readings against something independent: a lead line at a marked spot, the stated depth at a bridge pier, or a dredged channel edge you can see from above. Agreement within a foot or so in shallow water is what this class of gear can deliver.
7. Turn the Readings Into a Map
Preparation comes first. Put every run into a single table with columns for depth, latitude, longitude, timestamp, run name, and water level. Sorting by run lets you exclude a bad pass and survey again instead of trying to repair it in the map.
Tide and water level go in before anything else. Every depth is a depth below the surface at that moment, and the surface moves. If you surveyed the same bar twice a month apart and got different numbers, the bar may not have moved at all. Record the water level or tide state with each run, even roughly, and apply the correction in one pass later rather than editing records by hand.
Then plot. Load the points into a mapping program, colour them by depth, and let it interpolate a surface between your lines. QGIS does this well for free: make a layer from the point table, run an interpolation to a raster, apply a hillshade and a colour ramp, and draw contours from the raster. openCPN or OpenPlotter handles the same data if you want the map to sit under your navigation display while you sail. Phone apps that draw contours live are fine for scouting and awkward for anything you want to edit.
Label what matters. Mark the shallowest point on each line, the edges of shoals, and any drop-off you care about. A contour map without hazards marked on it is wallpaper.
8. Export and Use the Map Safely
Save both the raw file and the finished map, in the same folder, with the survey date in the name. In two years the raw soundings will be the valuable thing, because you can re-process them with a better offset or a tide correction without going back on the water.
Write a short accuracy note on the map itself: date surveyed, water level, offset used, and what you checked it against. Someone looking at this map in three years needs to know whether it was made on a flat calm morning or in a rising wind.
Update it. Sandbars move, dredging changes depth, and a year-old cheap map of an unstable approach is worse than no map because you trust it.
Then use it for what it is good for: fishing structure, planning a shallow approach in good visibility, scouting a creek before taking the bigger boat up it, planning dock and dredge work. It is a planning aid, not a chart. Commercial and community charts have published and reported groundings precisely because their depth data, however good, did not match the water on the day. Keep a proper chart and your depth sounder on board at all times, and treat disagreement between them as a reason to slow down, not as an error to argue about.
Common Mistakes
These five account for most disappointing first surveys, and each has a straightforward fix.
- Bubbles on the transducer. The display shows impossible shallow depths that come and go line to line. Mount lower, behind a clean bubble-free flow, and re-run the spot.
- Never calibrating the offset. Every depth on your map is wrong by the same amount, which is the worst kind of wrong because it looks consistent. Lead line, correct, record.
- Mixing time formats or merging runs blindly. Two files from different days land as one line and the map develops a ridge where nothing is there. Keep run names and water levels attached through the whole pipeline.
- Confusing air depth with water depth. Some displays show what is left below the transducer rather than the true bottom. Confirm which one you are reading before you trust a single number.
- Surveying too fast. You get a thin, spotty set of soundings and a map full of gaps. Slow down until consecutive pings overlap, and raise the ping rate if the unit offers one.
Tips for More Reliable Depth Maps
Reliability comes from repetition and bookkeeping, not from a better display. A few habits separate a map you trust from a screenshot you do not.
- Run repeat transects. Two or three passes over the same line in different conditions, averaged, removes a surprising share of the error. Seandepagnier on the OpenMarine forum argues for repeated surveys in different weather rather than one confident pass, and it is the single best piece of advice in the discussion.
- Record the transducer offset as a number, not a setting. Write the measured correction and the spot you measured it at next to the log. When it drifts in a year, you can tell.
- Use visible landmarks as checks. A pier with a published depth, a channel marker, a fixed cut in a rock wall. These are free ground truth and they do not need a battery.
- Hold a constant speed. Variable speed stretches your line spacing unevenly and makes the interpolation guess more between points.
- Watch the battery. Check voltage before the run and watch for depth jumps that repeat at the same place on every pass. That repetition is a power problem, not a bottom feature.
- Log the water level every run. Cheap units rarely know about tide, and the difference between a low-water and high-water reading of the same bar can be larger than every other error combined.
- Keep one run per file. Merging at the end is trivial; separating after you have merged a bad run is miserable. This is the exact problem people got stuck on when trying to build their own chart.
Frequently Asked Questions
Can a fish finder make a depth map?
Yes. A single-beam fish finder with GPS logging produces a set of depth readings tied to position, and mapping software turns those points into a contoured chart. It works well for showing structure, shoals, and drop-offs in a lake or bay, and it is how many anglers mark repeatable spots. It is not accurate enough to replace an official chart for navigation.
How accurate is a cheap depth sounder compared to a lead line?
In calm shallow water, a good budget unit usually lands within a few tenths of a foot of a lead line once the transducer offset is set. Most of the visible disagreement comes from the offset and from bubbles, not from the electronics. In deeper water the speed-of-sound error grows, and repeat passes plus an independent check tell you which case you are in.
Is a cheap depth sounder accurate enough to navigate by?
No. Treat it as a planning aid for shallow water and fishing structure, not as a navigation instrument. Users have reported groundings on community-generated sonar charts, because depth data and actual water conditions drift apart. Keep a proper chart and a working sounder on board, and treat any disagreement between your own map and your sounder as a reason to slow down.
Do I need to calibrate the transducer offset for shallow water mapping?
Yes, and it is the step most people skip. The offset is the difference between the transducer face and the bottom of the boat, and an uncorrected trolling motor transducer can read several feet deep. Measure real depth with a lead line, set the offset to match, and repeat the check at a second depth so you know whether the unit drifts as the bottom deepens.
How do I log depth and GPS together on a budget sounder?
Use a sounder that outputs NMEA 0183 depth sentences, and record them alongside your GPS track in a logger or charting program. Both streams carry timestamps, so each ping can be paired with a position afterwards. Log on a fixed interval of one to five seconds, keep one file per run, and write the water level on paper before you launch.
What software turns a depth log into a bathymetric map?
QGIS is the free workhorse: import the point table, interpolate the soundings to a raster, apply a colour ramp and hillshade, and draw contours from the result. openCPN or OpenPlotter does the same job and lets you carry the map on your navigation display. Phone apps that draw contours live are quickest for scouting and least flexible for editing.
If you only do three things this weekend, calibrate the transducer offset against a lead line, run ten parallel lines at a slow constant speed with logging on, and check three of your readings against something you already trust. Those three steps fix most of what goes wrong with a cheap depth sounder used for mapping, and everything after that is refinement.