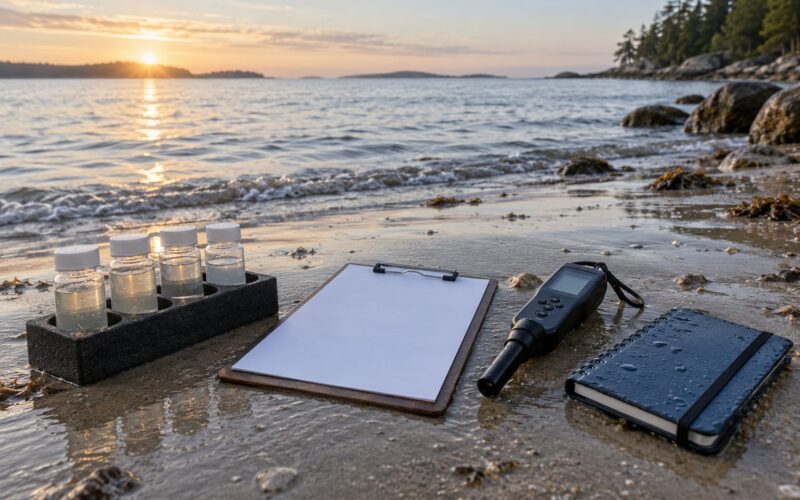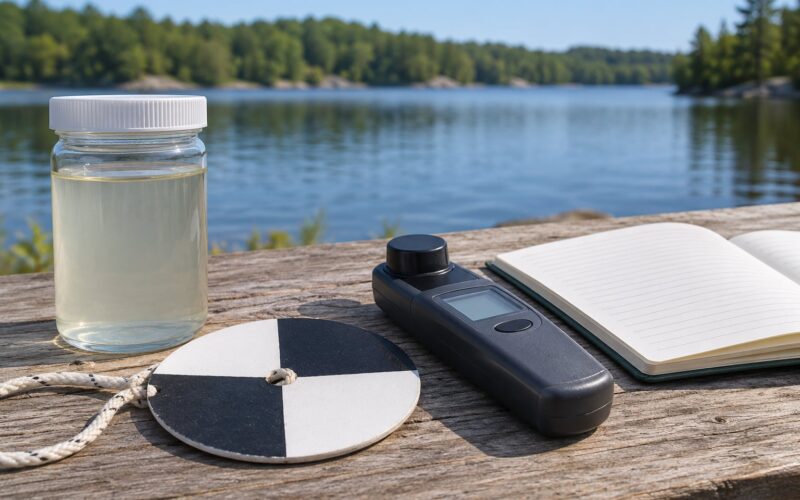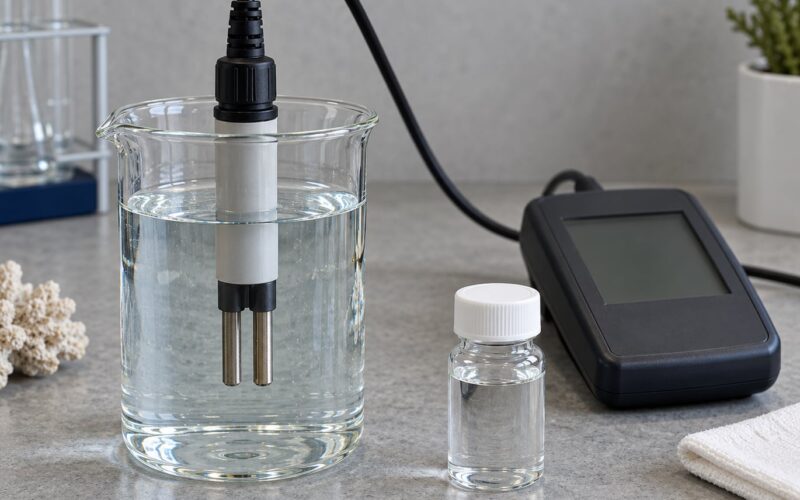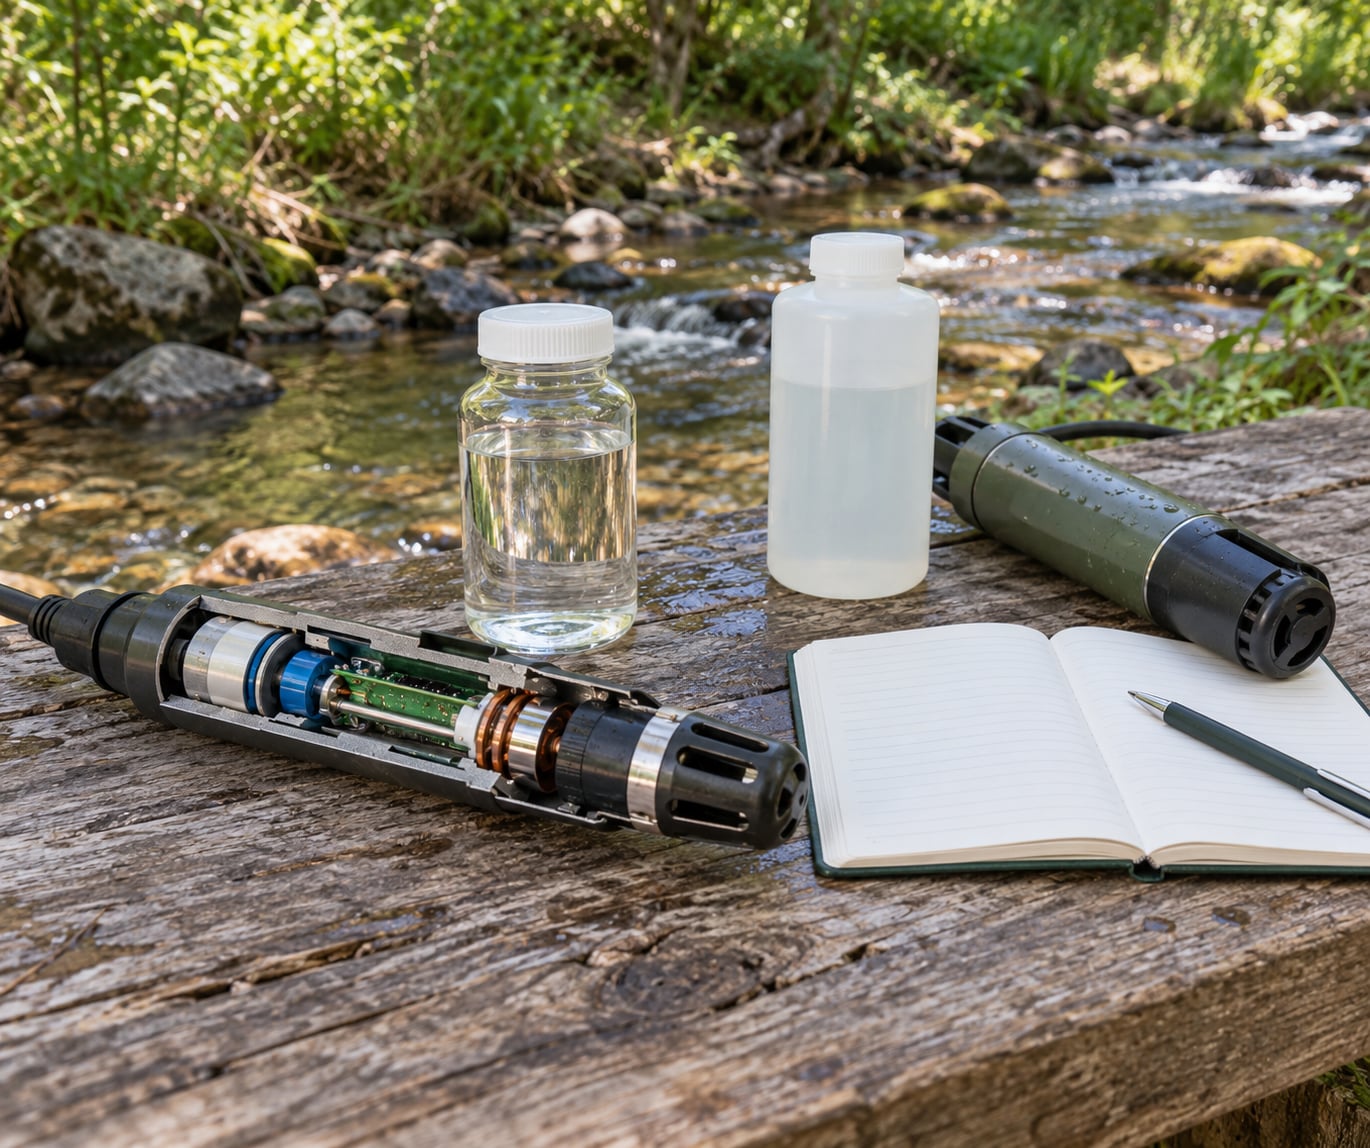
How citizen science water monitoring works: trained volunteers take repeatable measurements at a fixed site using standard kits, probes and phone apps, then upload the readings to a shared database where project scientists check them against quality rules. The result is a time series dense enough to reveal trends, pollution events and the effect of restoration work — and it only counts as science because the method is fixed before the first sample is taken.
Understanding the process matters because the value sits in the repetition, not in any single reading. One reading is a snapshot. A hundred readings at the same point, in the same conditions, taken with the same method, become a record.
This guide walks through who takes part, what gets measured, how volunteer data are checked, and where the data end up. It also covers the places where the method breaks down, because knowing the limits is what separates a screening tool from a regulatory instrument.
Table of Contents
- What Is Citizen Science Water Monitoring?
- How Does a Citizen Science Monitoring Project Work?
- What Do Volunteers Measure?
- How Do Low-Cost Sensors Compare with Laboratory Tests?
- How Does Citizen Science Water Monitoring Improve Data Quality?
- What Happens to the Monitoring Data?
- What Are the Limits and Risks of Volunteer Water Data?
- Frequently Asked Questions
- Conclusion
What Is Citizen Science Water Monitoring?
Citizen science water monitoring is the practice of non-specialists collecting and reporting water quality measurements from rivers, streams, lakes, ponds and coastal waters using agreed protocols, so their observations can be combined with professional government and research data.
Agencies cannot be everywhere. A professional network usually samples each site monthly at best, often quarterly, and many small streams and ditches have no record at all. Volunteer teams add hundreds of extra visits per year at a handful of sites, which is exactly where event detection, trend spotting and before-and-after comparisons come from.
The people doing this are not one group. School teachers run classroom protocols so students see a real time series. Riverkeeper groups and angling clubs sample monthly after a fish kill or a spill. Municipal staff use volunteers to build a denser picture between official stations. Hobbyists attach a probe to a weatherproof box and log a reading every hour.
The label has shifted, too. “Citizen science” is still the search term people use, but many projects now write community science or participatory science to describe work designed with communities rather than done on them. The mechanics do not change with the name: agreed question, agreed method, agreed data format.
Screening data versus measurements that need a laboratory
Most volunteer readings are screening data. A conductivity number from a consumer probe tells you something changed relative to last month. It usually does not tell you the concentration to the precision a regulator needs, and it never tells you what caused the change.
Anything with legal weight — an enforcement case, a permit number, a contamination threshold breach — runs on laboratory analysis with chain-of-custody sampling by trained staff. Volunteer data earns its place by screening large areas cheaply and then pointing professionals to where the follow-up should go.
How Does a Citizen Science Monitoring Project Work?
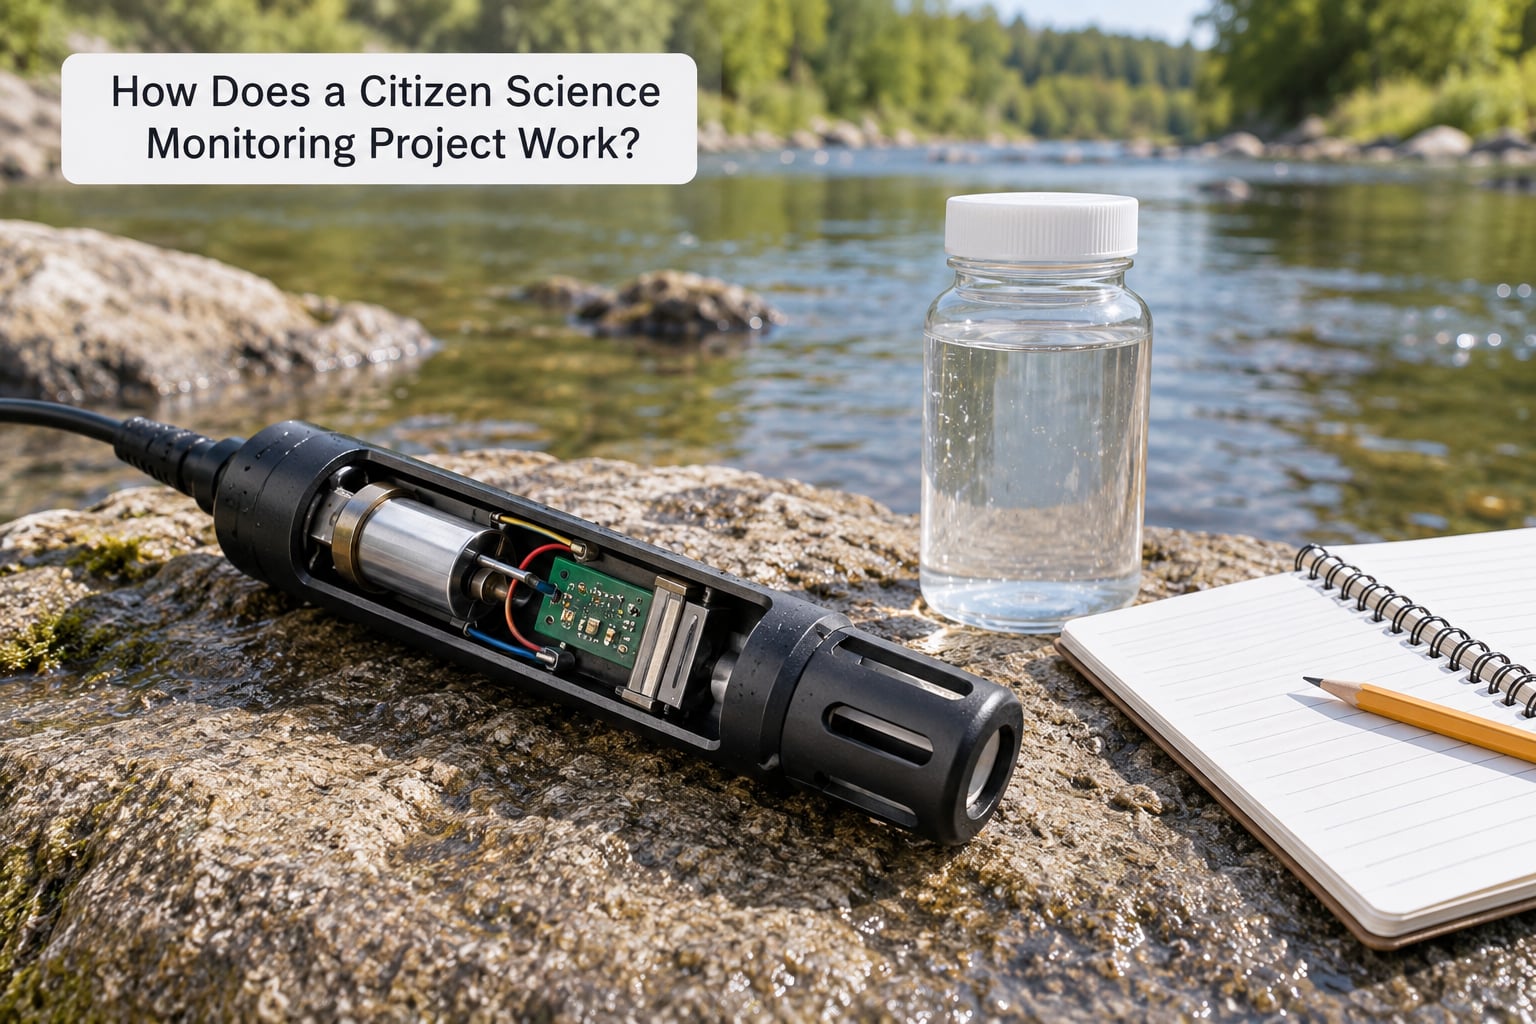
Every project runs the same loop, whether it involves three schoolchildren and a kitchen table or three thousand volunteers across a country. The loop is: define the question, standardise the method, collect on a schedule, check the data, publish, act.
The six steps of how citizen science water monitoring works
- Choose one question and one study area.
- Recruit and train the volunteers.
- Collect samples or sensor readings.
- Validate before publication.
- Publish the dataset.
- Use the findings to change something.
Step 1: Pick one question and a fixed study area
The most common failure is starting with equipment instead of a question. “Is nitrate rising below the new field?” or “Does the water clear after two days of rain?” gives you a site, a parameter and a schedule. A monitoring site is then fixed with coordinates and often a marker, so every future volunteer measures the same water and the series stays comparable.
Step 2: Recruit and train the volunteers
Training is short — often an hour or two, plus a supervised first visit — and it covers the parts that produce bad data: how to rinse the probe, when to run a blank, how to read a colour chart in daylight versus shade, what to do when a reading looks impossible. Volunteers who skip training produce outliers; projects that require a supervised first trip see far fewer of them.
Step 3: Collect samples and sensor readings
Visits follow a schedule set by the question. A storm-event study needs visits within hours of rainfall, a seasonal study needs the same week each month, a trend study needs the same fortnightly slot regardless of weather. Each record carries the same fields: who, when, where, what was measured, with which instrument, and any conditions worth noting.
Step 4: Validate before the data go anywhere
Raw readings pass through rules before they enter the public dataset. Values outside plausible limits are flagged rather than deleted, blank and duplicate results are checked, and a sample of records is compared against a reference site or a laboratory result. Flagged rows stay in the file with a quality code attached, because a suspicious reading with a note is more useful than a gap.
Step 5: Publish the dataset
Data leave the project as an open, documented file rather than a screenshot in a slide deck. Each row needs a timestamp, coordinates, the method, the instrument, the units and a quality flag. Researchers downloading a five-year CSV can then filter properly instead of guessing.
Step 6: Use the findings
This is the step that keeps volunteers coming back. A trend that shows a recovery after bank stabilisation gets presented to the council. A spike that repeats every Tuesday morning gets traced to a storm drain outfall. A consistent temperature rise in a shallow lake leads to an algal bloom warning. If nothing ever happens with the data, participation fades within a season.
What Do Volunteers Measure?
Most programmes concentrate on a core set of physical and chemical parameters that are cheap, quick and respond fast to change, then add a smaller set of nutrient and bacterial tests where the question calls for it.
| Parameter | What it shows | Typical method |
|---|---|---|
| Temperature | Drives oxygen solubility and biological activity; the most important correction for other readings | Thermistor or digital thermometer |
| pH | Acidity or alkalinity; shifts with runoff, acid rain and limestone geology | Colorimetric kit or pH probe |
| Conductivity (TDS) | Dissolved ions; a strong general signal of runoff, salinity intrusion or sewage | Conductivity probe or TDS pen |
| Turbidity | Cloudiness from suspended sediment; spikes reveal erosion or construction | Turbidimeter or Secchi disk |
| Dissolved oxygen | How much oxygen the water holds; the core signal of stream health | Winkler titration or optical probe |
| Salinity | Salt intrusion in estuaries; relevant where tides push seawater upstream | Refractometer or conductivity probe |
| Nitrate, phosphate, ammonia | Nutrient load; linked to algal growth and oxygen depletion | Colorimetric test kit |
| E. coli / coliforms | Sewage and faecal contamination; used for swimming and shellfish safety | Colony forming units or most probable number |
Notice the spread of methods. Temperature and conductivity come from a probe held in the water. Nutrients come from a reagent that changes colour, matched against a chart. Bacteria need overnight incubation or a defined counting method, which is why they stay in specialist programmes rather than every kit.
Ranges differ by water body, so a table of ideal values is only a starting point. Most volunteer guidance gives broad bands — dissolved oxygen above roughly 5 mg/L is generally healthy for cold-water species, pH between 6.5 and 8.5 supports most freshwater life — but a boggy lowland stream and a chalk stream are not comparable against the same target.
How Do Low-Cost Sensors Compare with Laboratory Tests?
Low-cost field methods trade laboratory accuracy for frequency, and that trade is the point. A volunteer can visit a site forty times a year; a laboratory might see it four times.
| Method | Calibration | Strengths | Weaknesses |
|---|---|---|---|
| Test strips | None; colour chart | Cheapest, pocket-sized, no power | Subjective colour matching, narrow accuracy, single-use |
| Colorimetric field kit | None; standard solutions | Specific parameters, good repeatability, long shelf life | Reagents degrade, limited detection range, sunlight affects colour |
| Digital probe | Before and during a run | Continuous logging, fast, no consumables | Drift, fouling, battery and enclosure failure, single-parameter units |
| Laboratory analysis | Full chain of custody | Regulatory-grade, wide parameter list, defensible | Costly, slow, needs a site within hours of collection |
Field probes fail in predictable ways. Membrane fouling by algae dulls dissolved oxygen readings, uncalibrated pH sensors drift, and a housing that is not sealed lets water sit against the electronics. Programs that get reliable results from low-cost sensors treat calibration and maintenance as part of the method rather than an optional extra.
Regulators and universities usually run split samples: the volunteer measures in the field, the professional measures the same bottle within hours. Agreement within the method’s stated tolerance is the evidence that the screening data are fit for purpose — and this comparison is where a project’s credibility actually comes from.
How Does Citizen Science Water Monitoring Improve Data Quality?
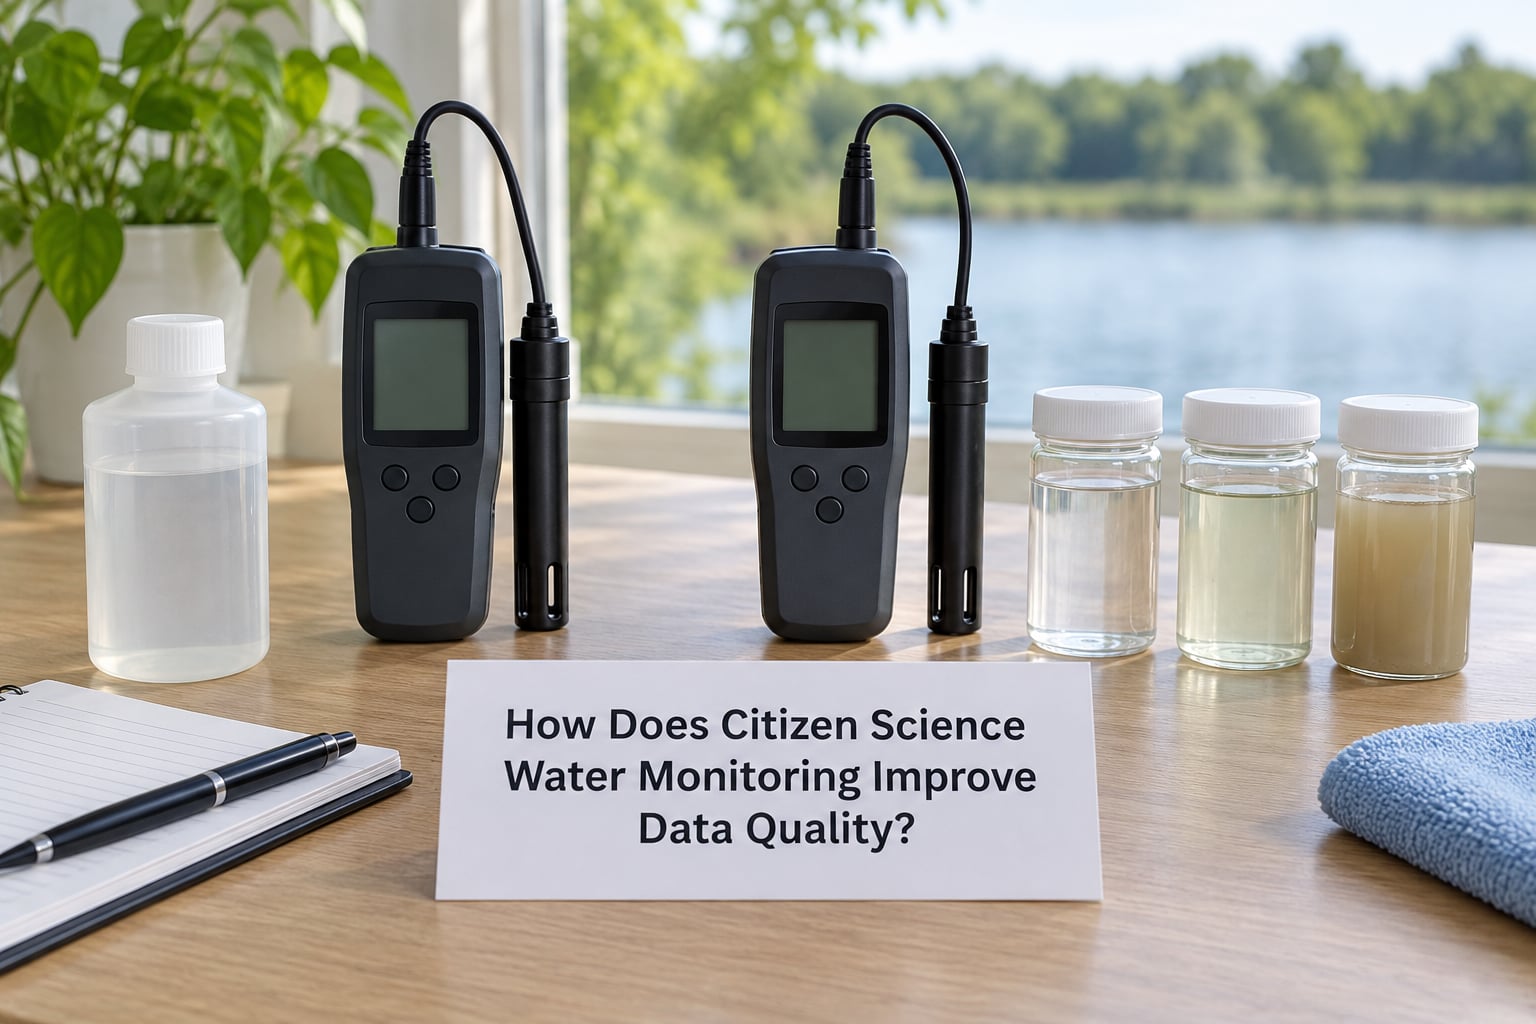
Reliability comes from removing choices, not from better equipment. Once the method fixes the site, the depth, the time window, the instrument and the number of repeats, the remaining error is small and random — the kind that averages out over a season.
Standard protocols. A written method that names the depth, the submersion time, the number of replicates and the weather conditions to record in. Two people following the same document should produce readings that agree.
Calibration. Probes are checked against a known solution before a session and at the end of it, so a mid-run failure shows up as a step change rather than a mysterious drift.
Blanks and duplicates. A blank of clean water reveals contamination from bottles or carry-over. A duplicate reading from the same spot reveals variance from the equipment and the operator. Both are cheap and both are skipped by inexperienced teams.
Metadata and fixed sites. Coordinates, timestamps, instrument identity, weather and the name of the observer travel with every value. Without them, five years of readings cannot be interpreted once the volunteer who took them has moved on.
Human review and reference checks. A project lead reads incoming records, returns questions about implausible values, and periodically samples the same site with professional equipment.
None of this makes volunteer data identical to laboratory data, and no project should claim it does. It makes the uncertainty small, known and stated — which is the standard that matters for a screening dataset.
What Happens to the Monitoring Data?
Raw submissions go through a cleaning and review stage before anything is public. Duplicate records are merged, obvious errors are corrected against the original notes, and every value carries a quality flag describing how it was obtained — measured on site, derived from a field kit, or imported from an agency.
Publication format matters more than most projects expect. A useful dataset is a plain CSV or similar open file with documented columns, ISO timestamps, decimal coordinates, named units and a method note per parameter. Anything that needs a specific app to interpret will not be reused by the researchers who would most benefit from it.
Three groups tend to end up using the data. Researchers draw on the density to fill gaps in models or to build long-term baselines where official records start and stop. Agencies use screening results to prioritise where to place an official station or to investigate a reported discharge. Communities use the record to argue for restoration funding, and increasingly to hold up a promise made years earlier.
Some frameworks are designed to accept community data, including the SDG 6.3.2 indicator on ambient water quality under the UN’s water goals, and the European Water Framework Directive, which has formal routes for public participation. Accepting data is not automatic: it still has to meet documented quality requirements.
Contributors should also know where to look when they want to see their own records, and whether results come back to them in any form. A project that publishes but never reports back is asking for free labour.
What Are the Limits and Risks of Volunteer Water Data?
Protocol drift. When experienced volunteers leave, the informal knowledge goes with them unless it is written down. Readings stay plausible while slowly changing method.
Equipment faults nobody notices. A dead sensor can log a flat line indefinitely. Constant values are the classic warning sign and are easy to check automatically.
Location bias. Volunteers sample where they can reach, often near a path or a bridge. That is a convenience sample, and it may miss the tributaries where the runoff actually starts.
Weather and season. One-off readings say little in systems that swing hard with rainfall or temperature. A single high nitrate value after a storm may say more about the storm than about the catchment.
Bacteriological risk. Working with sewage-contaminated water or handling E. coli samples is not risk-free. Programmes that include bacteria testing normally say so plainly and set rules about washing hands, not swallowing water, and not sampling alone after a pollution report.
Privacy. Water points can be sensitive. Locations near a private intake, a sewage overflow or a contested discharge can identify or embarrass people, so some projects blur or offset coordinates for the public dataset while keeping the exact point internally.
Overinterpretation. The most common misuse is treating a screening reading as a compliance verdict. A result outside a guideline band is a prompt for a proper sample, not an accusation.
Escalate to professional testing when a result suggests contamination, when a regulatory threshold is in question, when a trend is being used to support enforcement, or when the site is unfamiliar enough that nobody can interpret the reading.
Frequently Asked Questions
Do citizen science water-quality measurements qualify as scientific data?
They qualify when the method is written down in advance, the site is fixed, the protocol is followed consistently and the uncertainty is stated. Under those conditions volunteer readings support trend analysis, screening and hypothesis testing. They do not automatically meet regulatory requirements, which normally need chain-of-custody sampling and accredited laboratory analysis. Projects that want defensible data build the comparison against reference measurements into the method from the start.
What is the cheapest way to start monitoring local water?
The cheapest useful start is a written protocol, a fixed site, a thermometer and a handful of test strips or a colorimetric kit, plus a phone for photos and notes. Total depth of measurement stays secondary to repeatability. A volunteer who logs the same parameters at the same point for a year learns far more than one who buys an expensive multi-parameter probe and visits twice. Check whether a local programme already lends equipment before buying anything.
How accurate are inexpensive water-quality sensors?
Inexpensive probes are good enough to show direction and repeated change, and unreliable as absolute values. Expect drift in pH, membrane fouling in dissolved oxygen sensors and a two-way error in cheap conductivity meters. Calibration against a known solution, before and after each session, cuts most of that error. Publishing the method, the calibration record and comparison results with a professional station is what converts an approximate reading into usable screening data.
Can one phone measure water quality without a special sensor?
A phone can do the parts that are not chemistry: photographs of a staff gauge for water level, GPS coordinates, timestamps, notes and a virtual staff gauge overlay. It cannot read pH, dissolved oxygen or nutrients on its own. Some apps pair with a Bluetooth probe so readings land in the app automatically, which removes transcription errors but does not improve the sensor. Treat the phone as the data system, not the instrument.
Who can use citizen science water-monitoring data?
Anyone. Open datasets are normally free to download for research, local reporting, education and personal projects. Researchers use them to extend spatial and temporal coverage, agencies use them to prioritise official monitoring, and communities use them to document change over time. Check each project’s licence before reuse, because some keep exact coordinates private where sites are sensitive, and most ask you to cite the project and the volunteer team that collected the data.
Conclusion
The measurement-to-action cycle is short and simple: agree a question, fix a site, follow one written method, check the readings, publish them, and show people what changed. Every step is ordinary, which is exactly why a school class, a fishing club and a national programme can all run the same process.
So the first step is small. Choose one water-quality question you actually care about, adopt an existing published protocol rather than inventing your own, and test your setup against a trustworthy reference point for a month before you add volunteers or equipment. If you are starting fresh in 2026, that first month is what decides whether the second year happens — and whether your data ends up in someone else’s analysis.