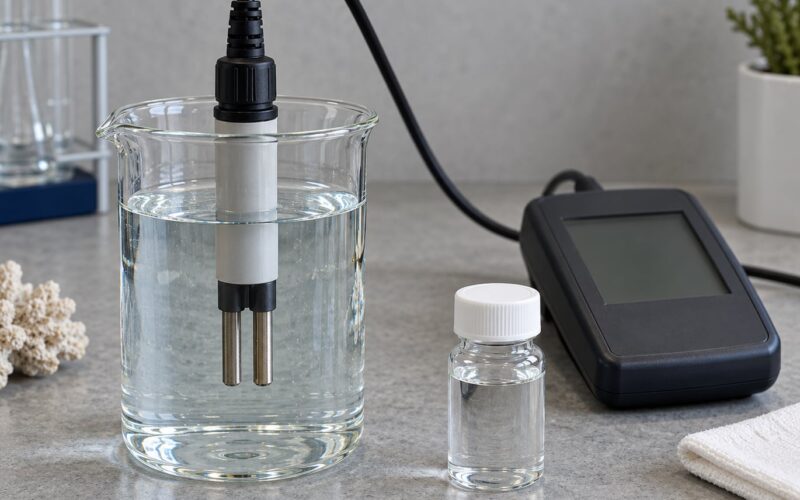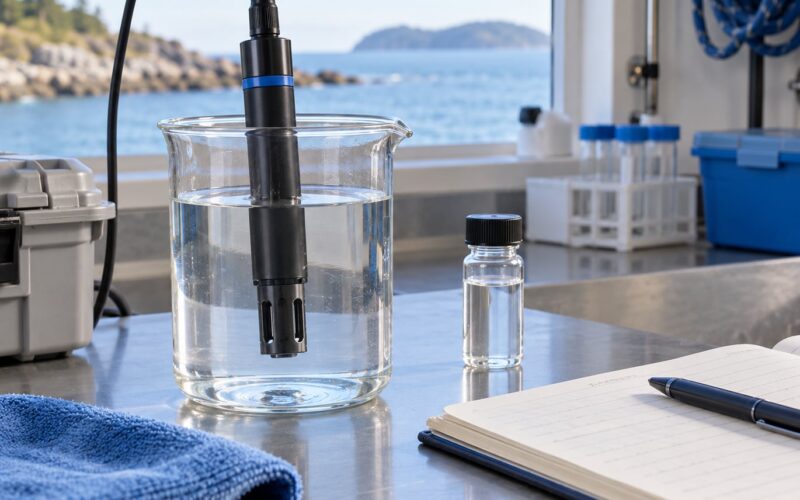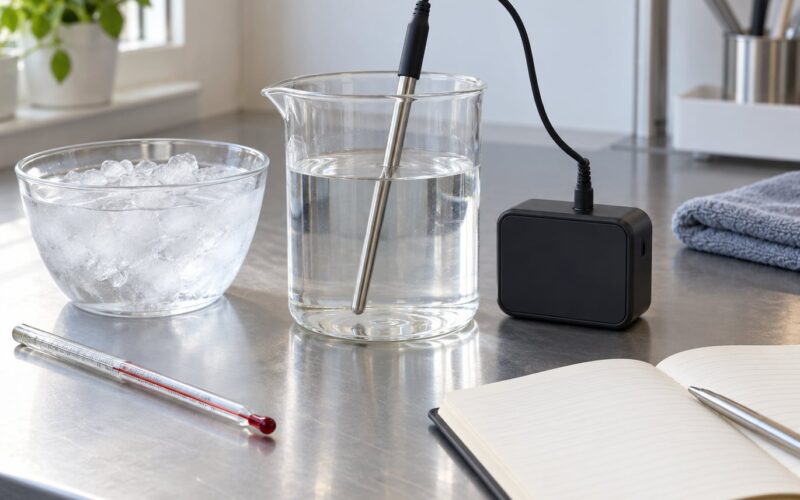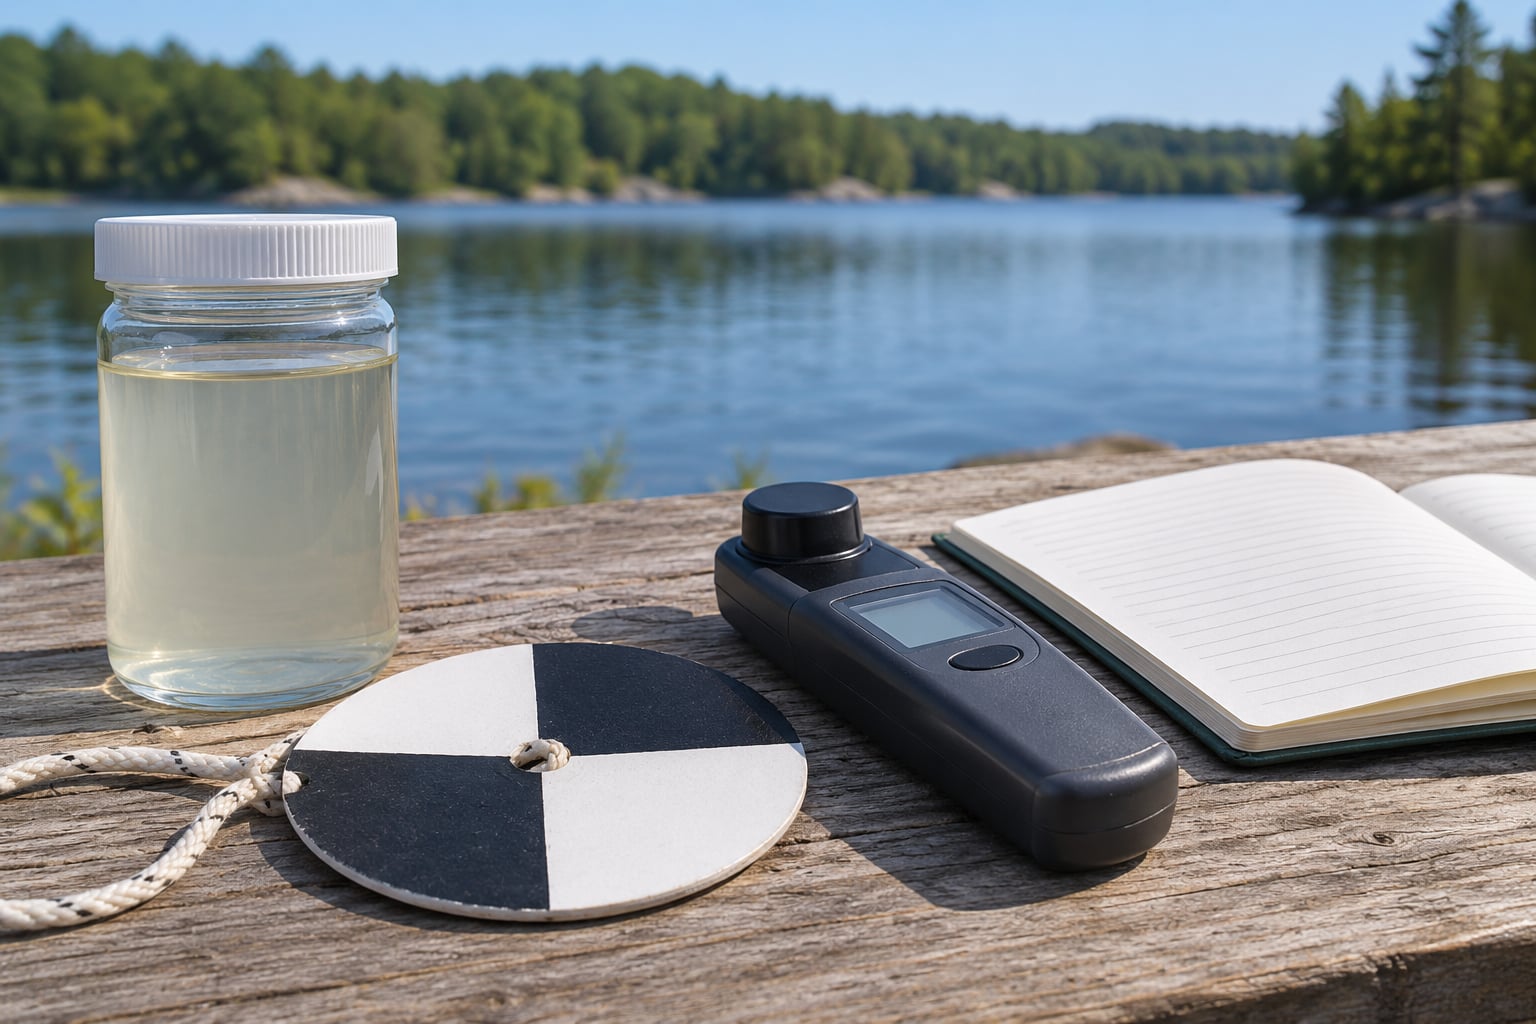
You can measure water turbidity with an electronic nephelometric meter that reads in nephelometric turbidity units (NTU), with a handheld turbidity tube you read by eye, or with a black-and-white Secchi disk that gives a depth in centimetres or metres. The meter is the right tool when you need repeatable numbers; the tube and disk are for fast field observations where equipment is the constraint. Whichever you use, the method and the conditions go in your notes, because a reading without that context is not reusable.
Turbidity is simply how cloudy water is. Suspended particles — clay, silt, algae, organic matter — scatter and absorb light, and the instrument measures that light rather than the particles themselves. That distinction matters later, when you try to turn a number into a sediment concentration and the conversion will not hold. The guide below covers four measurement methods in the order most people actually need them, plus the reporting habits that make any of them worth keeping.
Table of Contents
What You Need
What you need depends on which method you run, but a few items earn their place in every kit.
- Representative samples. Grab them from the depth you actually care about, in clean containers with no scratched or frosted walls. A scratched cuvette will scatter light on its own and inflate every reading.
- A clean working surface and gloves. Fingerprints on an optical window read as particles.
- Filtered or distilled water for blanking and for zeroing.
- Field notebook or data logger. Time, location, depth, water temperature, weather and instrument go with the number or it is not a measurement.
- Basic PPE. Gloves and eye protection, at minimum, and non-slip footwear if you are on a boat, dock or stream bank.
Add to that depending on the method: a Secchi disk with a marked line for the disk method, a turbidity tube for the visual check, a calibration solution such as formazin plus a certified optical standard for the electronic method, and a spectrophotometer with the validated method for lab work. Instruments that claim compliance with a specific method should have the matching standard on hand.
Prepare the sample last, right before reading it. Suspended particles start settling the moment the water moves, and a sample that sat for twenty minutes is no longer the water you pulled.
Step-by-Step: How to Measure Water Turbidity
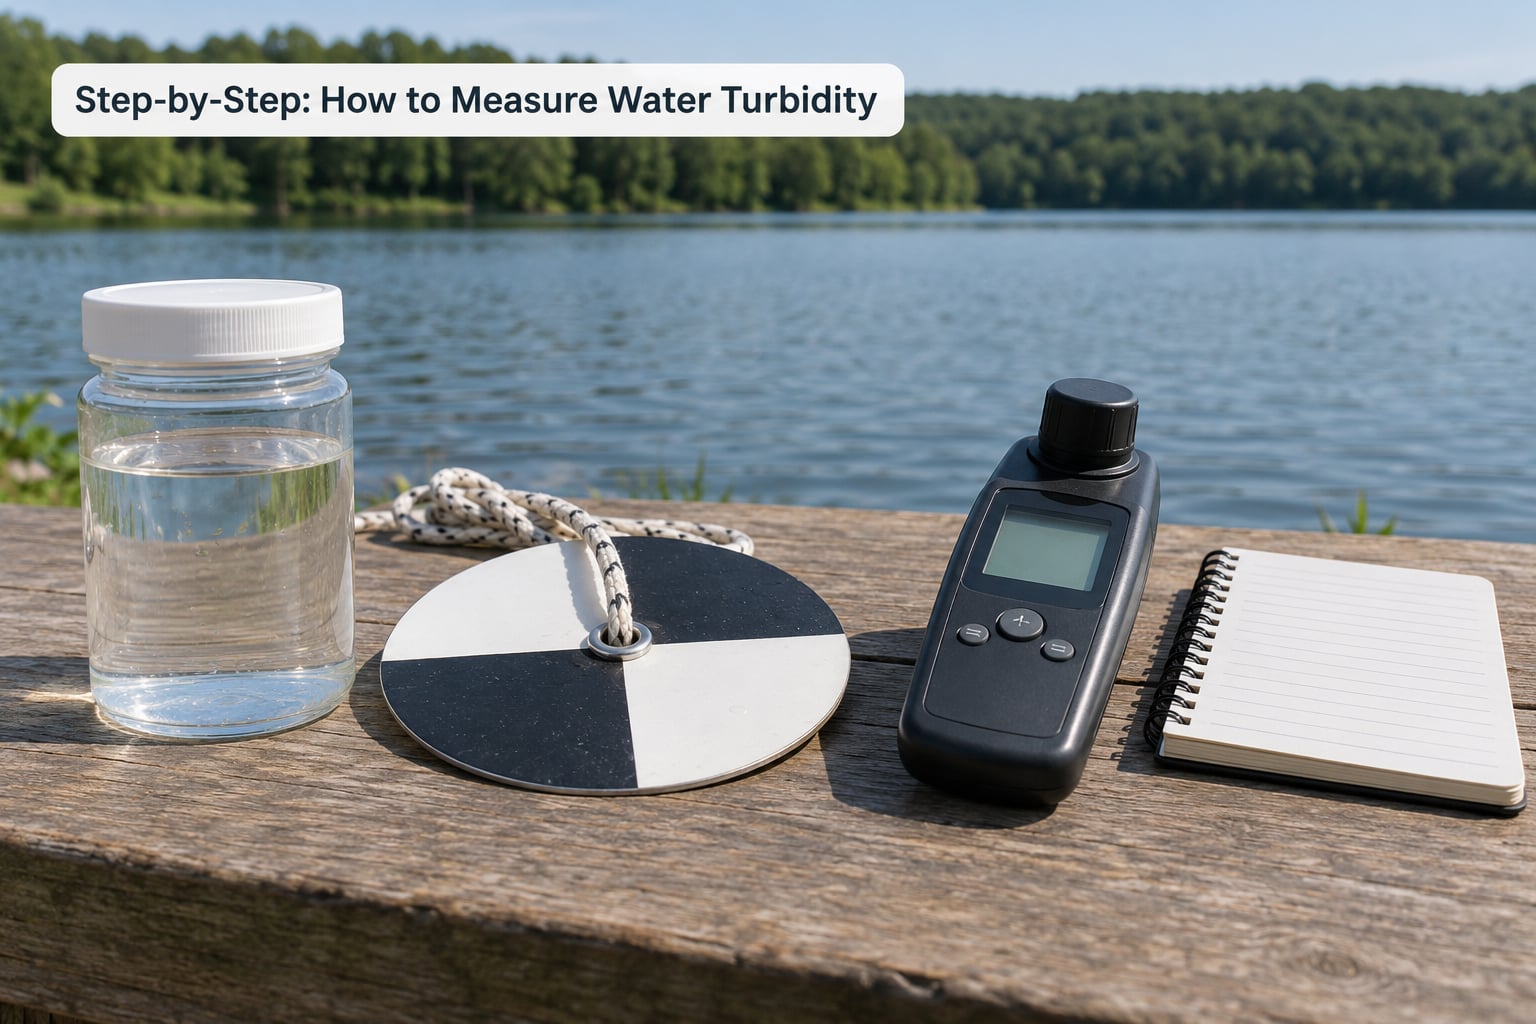
Four methods cover almost every situation. The table compares them before the individual procedures.
| Method | What it measures | Output | Best used for |
|---|---|---|---|
| Secchi disk | Depth at which a patterned disk stops being visible | Depth in cm or m | Reservoir, lake and estuary clarity trends over time |
| Turbidity tube | Depth at which a printed pattern disappears down a clear tube | Depth or the device’s own scale | Fast field checks with no power and no calibration |
| Optical sensor (nephelometer) | Light scattered by particles, usually near 90 degrees | NTU, FNU or FTU | Repeatable readings, treatment control, deployed monitoring |
| Spectrophotometer | Absorbance of a prepared sample, converted by the method | Absorbance, then method units | Comparable, reportable laboratory data |
Step 1: Measure Clarity With a Secchi Disk
Use the disk method when you care about how deep light travels, and when you will be taking the same reading repeatedly for comparison. It is the classic approach for lakes and reservoirs, where the same staff, disk and marked line give you a time series nobody has to interpret.
Lower the disk from a boat or from a marked line on a dock, and record the depth at which the disk disappears from view. Raise it slowly and record the depth at which it reappears. Average the two values and round to the nearest centimetre. Repeat the drop at least three times, at the same spot and roughly the same time of day, and report the mean. Two observers reading the same drop should agree closely; if they do not, the water is changing or the surface is too chopped to read.
Know the limits before you publish the number. Secchi depth is a clarity measurement, not a turbidity unit, and it cannot be converted to NTU reliably because it depends on particle size, colour, light and the person reading it. Two studies on the same lake can report different Secchi values for water that a meter reads identically.
Step 2: Use a Turbidity Tube for a Quick Field Check
A turbidity tube is a clear tube of known length with a crosshair or pattern printed at the base. It is the cheapest way to answer “is this water getting worse?” in a place with no power and no budget.
Fill the tube from the sample, looking down through the top as you pour so you do not stir the water hard or trap bubbles. Hold the tube at eye level in good light and let the sample settle. Note the depth at which the pattern disappears, then read that depth off the scale on the tube. Compare the result with the manufacturer’s conversion chart, if the tube has one, rather than assuming a universal scale — the numbers printed on cheap tubes are not comparable between brands. Repeat on a second sample before you act on the reading.
Use it for relative change rather than absolute number if the tube has no verified calibration. A sudden drop in visible depth from one visit to the next tells you something real.
Step 3: How to Measure Water Turbidity With an Optical Sensor
This is the method for repeatability. A nephelometer passes light through a sample and measures the light scattered sideways, most often at 90 degrees, then converts the signal to NTU. Instruments that follow EPA Method 180.1, GLI Method 2, ISO 7027 or DIN EN 27027 use comparable principles, which is why their numbers line up when the samples are comparable.
Zero the instrument with clean filtered water, or blank it with the sample if your instrument supports that. Then check it against a calibration solution of known value, typically a formazin primary standard or a traceable secondary standard, and record the reading you get back against the value on the bottle. If it has drifted, recalibrate before you touch a real sample.
Mix the sample gently, fill the vial to the fill line, and wipe the outside of the optical window with a lint-free lens tissue. Check the window for scratches under a light source; a scratch at the detection angle will read high forever. Place the probe or vial so nothing touches the optical surfaces, close any light shroud or lid, and wait for the reading to stabilise. Record the value and its unit. Report NTU, FNU and FTU as the unit the method specifies rather than swapping labels, because the light source and detection angle differ between them even though the numbers are close in clean water.
For inline or submersible sensors, immersion depth matters as much as the reading. Keep the optical window fully submerged and away from the air-water interface, where bubbles cling, and protect the cable with strain relief. Rinse between samples.
Step 4: Measure a Sample With a Spectrophotometer
A spectrophotometer measures how much light a sample removes from a beam rather than how much it scatters sideways, and it needs a validated method to turn absorbance into a turbidity result. Use the wavelength and conversion the method specifies; do not borrow a neighbouring method’s settings because they happen to give a plausible number.
Prepare the sample as the method requires, mix it thoroughly, and transfer it to a matched clean cuvette. Run the method’s blank, which is usually filtered water or a turbidity-free diluent, then zero the instrument on it. Read the absorbance, convert it using the method’s own relationship, and repeat on a fresh portion. If the two results disagree by more than the method’s stated tolerance, repeat rather than average a bad reading into a good one.
Remember that the cuvette path length is part of the measurement. Two instruments with different cell sizes running the same method will not return identical absorbances, which is another reason the method name belongs in your report.
Step 5: Repeat and Report the Measurement
Take at least three readings on separate portions of the same sample and calculate the mean. Also note the spread — the range or standard deviation tells the next person whether your three numbers agreed, which is more honest than the mean alone.
Record, for every reading: the date and time, the sample location and depth, the water temperature, the weather and any recent rain, the instrument make and model, the method it follows, the calibration standard used and its check result, the unit, and the known limitations of that method. A reading of 42 NTU is useless on its own; a reading of 42 NTU with a mean spread of 1.8 NTU, taken at 0.5 m in the estuary channel at 09:15, on a calibrated meter, is data someone else can use.
Compare the result to a laboratory standard when the decision matters — a drinking water compliance call, a published study, or a dispute about a trend. Field instruments drift, and a check against a certified standard at the end of a deployment is how you find out.
Common Mistakes
Almost every bad turbidity reading comes from one of a small number of sources.
Stirred or settled samples. Shaking the container aerates the water and sends the reading high. Mix gently, read promptly, and never shake.
Air bubbles on the window. Bubbles scatter light strongly. Tap the vial, let the sample sit for a minute, and wipe the outside rather than the inside of the window.
Dirty or scratched optics. A smear or fingerprint reads high. Clean with a lint-free tissue, and check the window under a light before every deployment. A deep scratch is not something you can clean away — it reads high from that point on.
Confusing Secchi depth with NTU. They are different quantities with different units and no fixed conversion. Label the field “Secchi depth” and the meter field “NTU” and never mix them in one chart.
Measuring sunlight instead of the sample. Stray light leaking into a sensor inflates the reading. Use a light shroud, keep the sensor away from direct sun, and take comparative readings at the same time of day.
Skipping the blank or the calibration check. Without a blank, instrument drift shows up as a change in the water. Check against the standard at the start, and again at the end of any deployment.
Poor immersion. A partly submerged probe or one sitting in the air-water interface reads whatever is on the bubble side of the window. Fully submerge, and set the sample flow if the instrument is flow-through.
Changing conditions mid-test. Rain, a passing boat or a stirred shoreline will move the number. Note the conditions, and repeat the reading when they settle rather than reporting a value you know is unstable.
One last practical tip: for long deployments, write the cleaning interval on the instrument itself. Biofouling is the single biggest cause of data loss in a multi-week deployment, and a wipe schedule that lives in your notebook gets skipped.
Frequently Asked Questions
What is the difference between turbidity and water clarity?
Turbidity is an instrument reading of how much light suspended particles scatter or absorb, reported in NTU, FNU or FTU. Clarity is a visual description, and a Secchi depth is the distance at which a disk or pattern stops being visible. One is an optical measurement; the other depends on light, particle colour and the observer. Keep them in separate fields.
Can a Secchi disk replace a turbidity sensor?
Only for long-term clarity trends on still water such as a reservoir or estuary. A disk gives you depth, not a turbidity unit, so it cannot be compared with NTU data from a study or a compliance record. It also cannot separate fine sediment from algae. If you need numbers that transfer to other datasets, use a calibrated optical sensor.
Which units is turbidity measured in?
Most modern instruments report NTU, FNU or FTU. In clean water these read almost identically, but they are defined differently: NTU and FTU use white light with 90 degree detection under EPA Method 180.1, while FNU uses near-infrared light under ISO 7027. Always state the unit and the method, because a coloured or particle-rich sample can make the readings diverge.
Which method should I choose for a river or an aquarium?
For a river with changing flow and sediment, an inline or handheld optical sensor gives you a usable time series, and the turbidity tube works as a weekly check between visits. For an aquarium or aquaculture tank, a low-range meter is better because your water stays clear and you are chasing small changes. For an open coastal station, a submersible sensor with a wiper and a scheduled blank check beats repeated site visits.
How often should I calibrate a turbidity meter?
Zero with filtered water before each session and check against a calibration solution of known value at the start of a deployment and again at the end. For reporting data that has to be defensible, work to the verification frequency stated in your method. If the check reading differs from the standard’s value, recalibrate and note the correction in your log rather than adjusting numbers later.
Conclusion
Start where you are: a Secchi disk or turbidity tube answers “is this water getting clearer or murkier?” today, with no equipment budget. Move up to a calibrated optical sensor when you need numbers that repeat, and to a validated laboratory method when the data has to match someone else’s or stand up to review. Whatever method you use, write down the method, the unit, the depth, the temperature and the calibration check alongside the number — that note is what turns a reading into a measurement you can trust later.
One last thing: standards get revised, so check the current edition of the method you name rather than trusting a number copied from an old report. As of 2026, the references used most often for this work are EPA Method 180.1, ISO 7027 and the GLI method adopted by many commercial meters.