To build a sensor dashboard, chain four layers together: read the sensors, move the readings over a network protocol, store them as time series, and render them as live charts. Most working builds run all four on one small computer, so the whole thing survives with no internet connection. On a boat or an ocean drone that matters more than it does on a desk, because the radio link is the first thing you lose.
This guide walks through the pipeline I use for marine robotics test nodes: a Raspberry Pi reading a handful of sensors, Mosquitto as the MQTT broker, InfluxDB holding the history, Node-RED wiring the messages together, and Grafana drawing the panels. It is written for Raspberry Pi OS Bookworm, Mosquitto 2.x, InfluxDB 2.x and Grafana 11.x, and last checked in October 2026.
Table of Contents
- The 6-step process at a glance
- What You Need Before You Start
- Step-by-Step
- How to Build a Sensor Dashboard: define the measurements first
- Connect the sensors to the Raspberry Pi
- Install the dashboard software stack
- Publish sensor data with MQTT
- Store time-series measurements in InfluxDB
- Create and test the Grafana dashboard step by step
- Add alerts and offline operation
- Verify the dashboard at sea
- Common mistakes: what breaks and how to fix it
- Reliable marine dashboard tips
- Frequently Asked Questions
- Can a Raspberry Pi run a sensor dashboard on a boat without internet?
- Which dashboard platform should I pick for sensor data?
- Do I really need a time series database?
- How often should a sensor dashboard refresh?
- How do I calibrate sensor readings before display?
- Can one dashboard track several boats or robots at once?
- Conclusion
The 6-step process at a glance
- Decide which measurements matter and fix their names, units and safe warning ranges before writing any software.
- Read each sensor at the command line until the values are stable, then wire the sensors to the Raspberry Pi over I2C, SPI, UART or USB serial.
- Install Mosquitto, InfluxDB, Node-RED and Grafana on the Raspberry Pi and confirm each service starts.
- Publish every reading to a named MQTT topic with a unit suffix and an ISO 8601 timestamp.
- Store the MQTT messages in InfluxDB with a retention policy, then query them back to prove history is being written.
- Build the panels, set thresholds, then bench-test with controlled values before the vessel goes in the water.
What You Need Before You Start
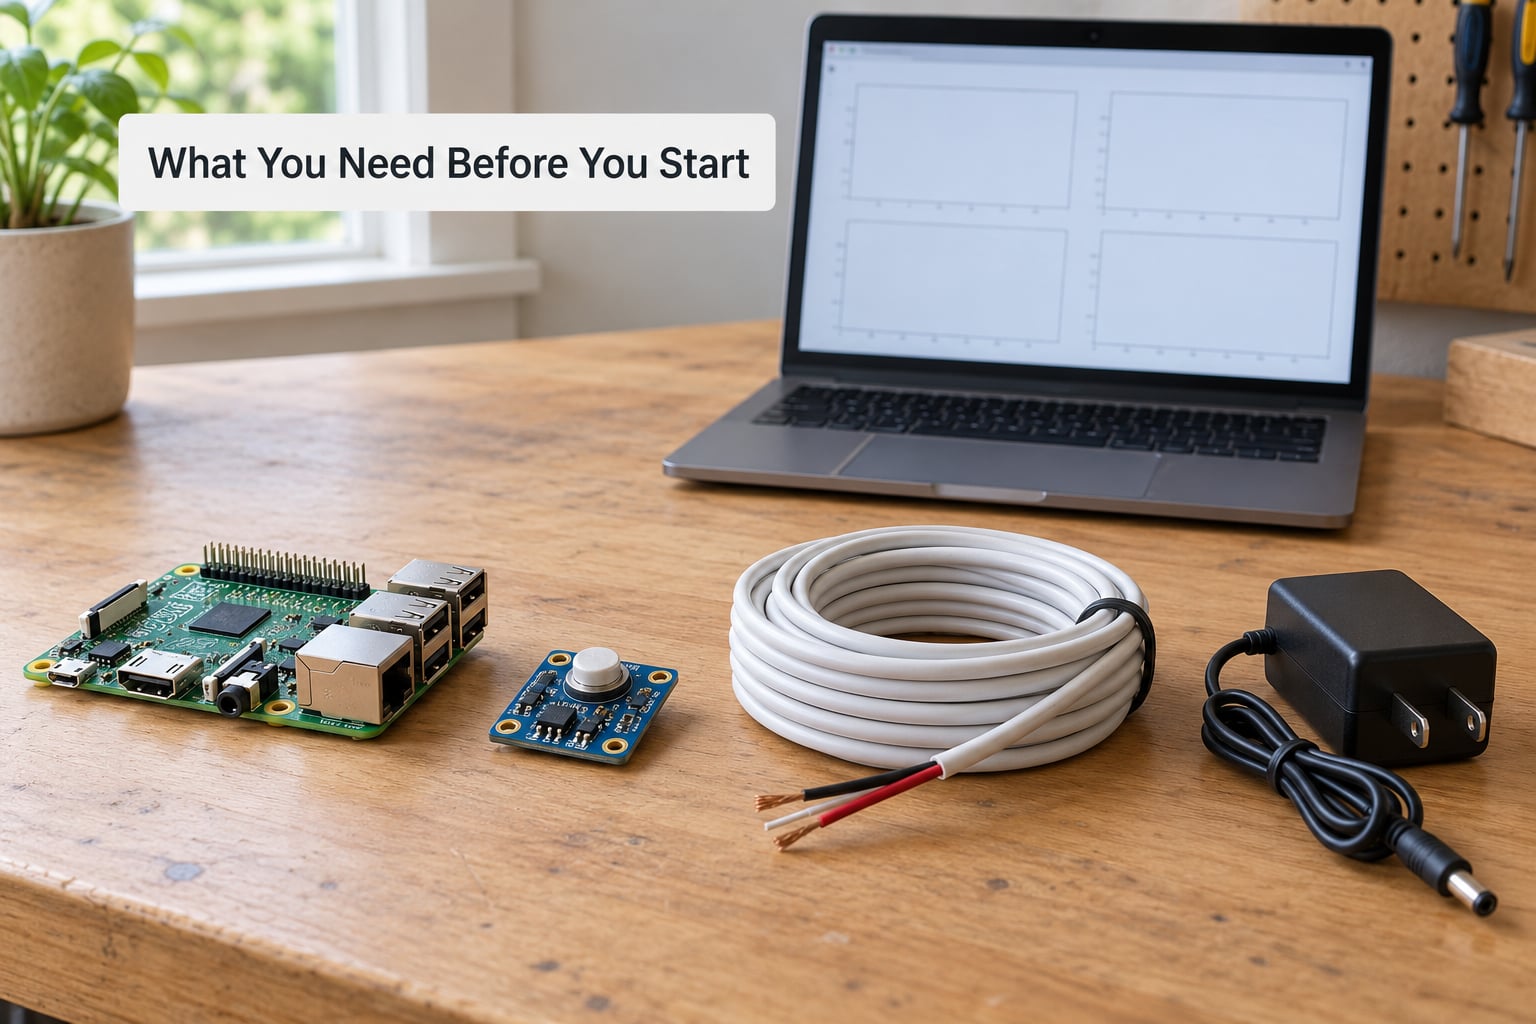
You need a single-board computer, sensors that speak a bus your board understands, and four pieces of open-source software. Everything here installs locally, which is the point: no subscription, no account, no data leaving the hull.
Hardware
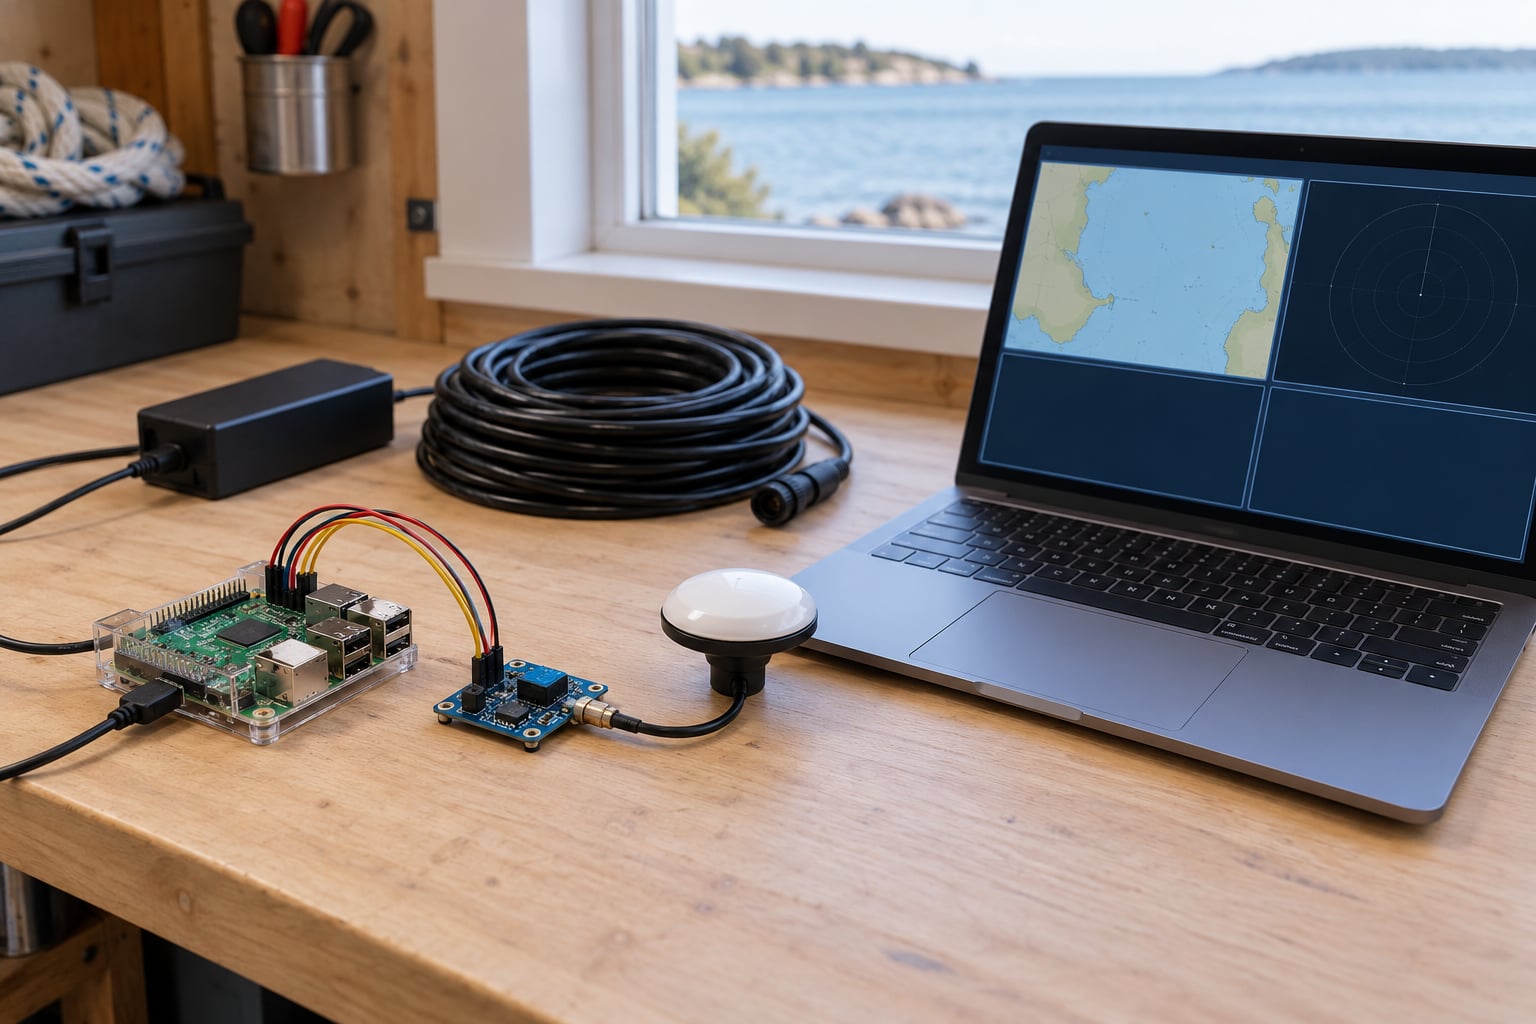
- A Raspberry Pi 4 or 5, or any single-board computer with USB and at least 2 GB of RAM. A Pi 5 handles several nodes comfortably.
- A marine-rated or fused power supply. A 12 V supply from the vessel with a fuse on the branch and a 5 V buck converter feeding the Pi. Never wire a raw 12 V rail straight into a board.
- A microSD card, 32 GB or larger, with Raspberry Pi OS Bookworm or later flashed and SSH enabled.
- Sensor breakout boards on short jumper leads: GPS with an antenna, water temperature, barometric pressure, an analog-to-digital converter for analog voltage sensors, and a battery voltage divider.
- A weatherproof enclosure with a vent for a pressure sensor, cable glands, and a drip loop on every cable that crosses the deck.
- A backup battery or supercapacitor so the Pi shuts down cleanly on a power cut instead of corrupting the database.
Software
- Mosquitto, the MQTT broker that sits between the sensors and everything else.
- InfluxDB 2.x, the time series database that stores readings as timestamped points.
- Node-RED, the glue that reshapes MQTT payloads into InfluxDB line protocol.
- Grafana, the dashboard that queries InfluxDB and renders panels.
Sensor interfaces you will meet
I2C carries short-distance, low-speed devices like temperature and pressure sensors. SPI is faster and suits displays and higher-rate sensors. UART is the usual path for GPS modules. USB serial turns anything with a serial console into a network node. Analog-to-digital converters, typically 12 or 16 bit, handle voltage, current and resistive sensors, and they need a stable reference voltage to be trustworthy.
Keep the low-voltage electronics physically separate from the vessel’s power system. Route sensor cables away from engine wiring, thruster cables and VHF feeds, and give the Pi its own fused branch.
Which dashboard platform should you pick?
This is the decision most people stall on, so it is worth settling before any wiring. Four options cover almost every build, and they differ more in effort than in capability.
| Option | Best for | Setup effort | Works offline |
|---|---|---|---|
| Grafana | Technical builds with a time series database, alerting and dashboard export | Low once data is in InfluxDB | Yes, fully local |
| Home Assistant | Sensors that already report to a home automation install, combined control and history | Low, but Lovelace layout is fiddly for beginners | Yes, fully local |
| Custom web app | A specific interface no off-the-shelf tool offers | Highest, you maintain it | Yes, if you serve it locally |
| Hosted BI streaming | Sharing read-only dashboards with people who never touch the hardware | Low, but needs a permanent link | No, panels stop without internet |
For a marine node, Grafana wins on a practical point: dashboards export as JSON, so a board failure or a swapped Pi is a ten-minute restore instead of an afternoon of rebuilding panels by hand. Self-hosters converge on the same pairing for the same reason, and the questions on r/grafana and the Raspberry Pi forum are far more often about platform choice than about setup.
Step-by-Step
How to Build a Sensor Dashboard: define the measurements first
Write down your measurements before you touch configuration, because every name you pick now becomes a topic name and a database field forever. A typical marine node tracks GPS position, speed over ground, heading, water temperature, barometric pressure, battery voltage and a sensor health flag.
For each one, fix four things: the data name, the unit, the update interval, and the warning range. Water temperature in degrees Celsius every 5 seconds with a warning at 30 is a complete spec. Barometric pressure in hectopascals every 30 seconds is another. Anything you cannot write down as a number with a unit is not yet a measurement, it is a wish.
Name fields in snake_case with the unit attached: water_temp_c, battery_v, gps_speed_kn. Putting the unit in the name means a downstream panel can never guess wrong, which is the single most common source of misleading charts.
Connect the sensors to the Raspberry Pi
Connect each sensor on its own bus, power the board, and confirm the reading is stable at the command line before publishing anything. If the number jitters at the terminal, no dashboard will fix it.
For I2C devices, enable the bus and scan for addresses:
sudo raspi-config
sudo apt install -y i2c-tools
i2cdetect -y 1
A response at 0x76 or 0x77 usually means a barometric pressure sensor. A 16-bit ADC shows up on the same scan. Read a few dozen samples and watch for values pinned at the ends of the range, which means the wiring, the reference voltage or the sensor itself is the problem rather than the code.
For a USB serial device, the port usually appears as /dev/ttyUSB0. Confirm it with ls /dev/ttyUSB*, then read it with a serial terminal before wiring it into MQTT.
Install the dashboard software stack
Install Mosquitto and Node-RED from the standard Raspberry Pi repository, and run InfluxDB and Grafana in containers so an upgrade never breaks your system Python.
sudo apt update
sudo apt install -y mosquitto mosquitto-clients nodered
sudo systemctl enable --now mosquitto nodered
Node-RED listens on port 1880 by default and Mosquitto on 1883 unencrypted, 8883 with TLS. Bind the broker to the local network interface only and set a username and password, because an open broker on a marina network is a real risk.
For the database and the dashboard, containers are the shortest path. Point them at a persistent volume so the data survives a container rebuild:
docker run -d --name influxdb
  -p 8086:8086
  -v influxdata:/var/lib/influxdb2
  influxdb:2

docker run -d --name grafana
  -p 3000:3000
  -e GF_SECURITY_ADMIN_PASSWORD=change-this-now
  -v grafanadata:/var/lib/grafana
  grafana/grafana:latest
Verify each step before moving on. systemctl status mosquitto should show active. Opening http://localhost:3000 should show the Grafana sign-in screen. Opening http://localhost:8086 should show the InfluxDB setup page, where you create an organisation, a bucket named marine, a password and a token. Keep that token; you need it in Node-RED.
Publish sensor data with MQTT
Publish each reading to its own topic under a vessel prefix, keep the payload flat and JSON-shaped, and retain the latest message so a dashboard opened later still shows a current value.
mosquitto_sub -h localhost -t 'vessel1/#' -v
mosquitto_pub -h localhost
  -t 'vessel1/sensors/water_temp_c'
  -r -m '{"value":18.4,"ts":"YYYY-MM-DDTHH:MM:SSZ"}'
Replace the placeholder timestamp with the real one from your reading, in ISO 8601 with a trailing Z, so the example shape stays obvious.
Arduinos, ESP32 boards and other microcontrollers can sit in front of the same broker if you would rather read the sensors there and let the Pi do the storing, which also frees the Pi from a lot of low-level bus timing.
Follow the split: the topic carries the identity of the measurement, the payload carries the value and the timestamp. A useful rule is to subscribe to a single vessel during commissioning rather than #, because a wildcard across a busy network floods the serial console with other boats’ data.
Send UTC timestamps with a trailing Z. Local time on a vessel is whatever the skipper’s phone says, and daylight saving shifts are a genuine headache when you overlay a chart against a tide table months later.
Store time-series measurements in InfluxDB
Create the organisation, bucket, credentials and retention policy during setup, then use Node-RED to convert each MQTT message into a timestamped point. The node chain is an MQTT input node, a JSON parse node, a template node, and an InfluxDB write node.
Line protocol is the format InfluxDB stores: measurement, tags, fields and a timestamp, all separated by unescaped commas and spaces.
water_temp_c,source=vessel1 value=18.4 0000000000000000000The measurement is the first token, source=vessel1 is a tag you can filter on, value is the field. The trailing digits are a Unix timestamp in nanoseconds, which Node-RED can build for you rather than you typing it. Set the retention policy on the bucket so old points drop out on a schedule rather than filling the card.
Prove history is being written with a Flux query before you build any panel:
from(bucket:"marine")
  |> range(start: -15m)
  |> filter(fn: (r) => r._measurement == "water_temp_c")
  |> aggregateWindow(every: 1m, fn: mean)
If that returns rows, storage works. If it returns nothing, the problem is upstream, in Node-RED, and no amount of dashboard work will surface data that was never stored.
Create and test the Grafana dashboard step by step
Connect Grafana to InfluxDB, then build panels from live values outward. Start with a stat panel showing the current water temperature so you can confirm the connection in one glance, then add a time series panel with a five-second refresh, and only then add gauges, bar gauges and tables.
Add the InfluxDB data source under Connections and Data sources, enter the local URL, and select Flux as the query language. Use an alias such as vessel1 so two vessels can share one panel. On every time series panel set the unit explicitly to Celsius, volts or knots, and set a sensible minimum and maximum so a flat line does not get autoscaled into a dramatic-looking mountain range.
Save the dashboard, then export it as JSON. Keeping the dashboard JSON in version control is how you rebuild it in ten minutes after a card failure rather than rebuilding it by hand, which is a question that comes up constantly on self-hosting forums.
Test with controlled values before the vessel sails. Publish a known temperature, a known voltage and a deliberately out-of-range reading, and check that the panels move and that the thresholds behave as you wrote them.
Two adjustments make a live view easier to read. Pause or slow the refresh on any panel nobody is actively watching, since a chart rewriting itself every second is hard to follow. And put a plain data table alongside the charts for anyone reading the dashboard on a phone in glare or through a screen reader, because a line chart alone is not usable in every situation a field tech will meet.
Add alerts and offline operation
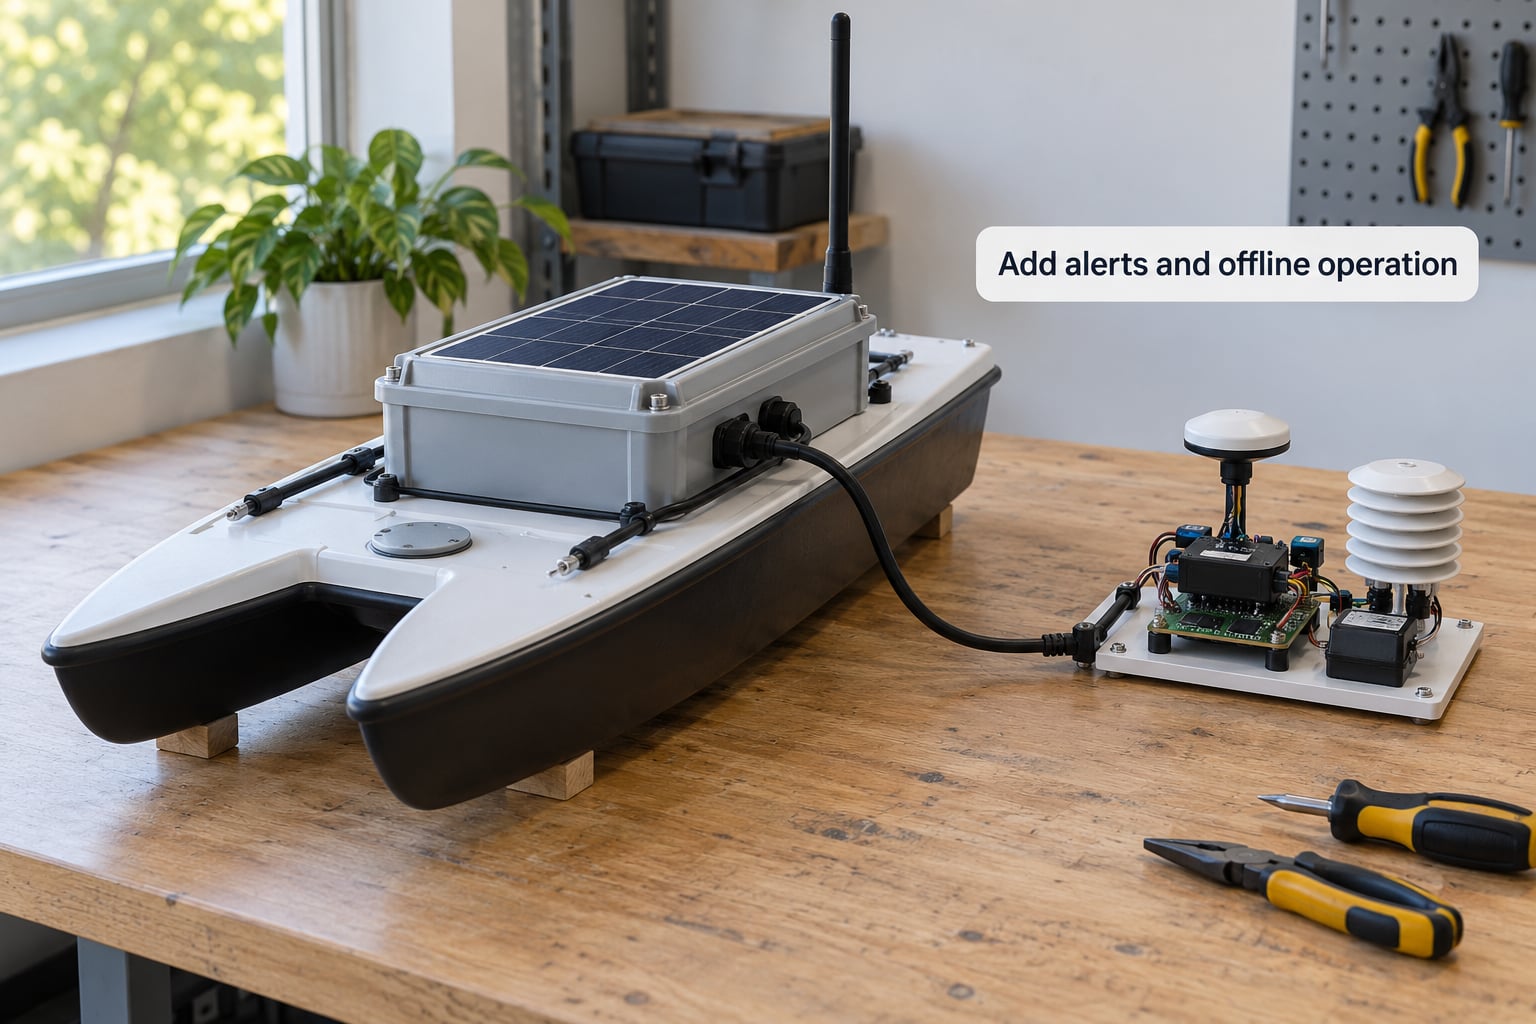
Set alert rules on the thresholds you defined in step one, and separate the ones that wake someone up from the ones that just get logged. A low battery voltage or a silent sensor is urgent. A water temperature above 30 degrees on a hot afternoon is a note in the log.
In Grafana, an alert rule carries an is above or is below condition, a hold duration so a single spike does not fire, and a contact point that decides where the message goes. Add a second rule on a heartbeat: if no message has arrived from a sensor topic for longer than three expected intervals, the rule fires with a sensor silence alert. Silence is the failure mode people forget, because a chart with no new data still looks like a chart.
For offline operation, keep every service local and accept that nothing reaches the internet. Configure the broker and database to keep running through a router reboot, enable all four services at boot, and buffer writes on the sensor node so readings taken during a dropout are sent when the link returns. On a sailing robot the radio link drops constantly; a dashboard that empties itself every time the antenna loses the shore station is useless.
Size power from the duty cycle. Measure the Pi’s draw with a USB meter, multiply by the wake interval, add the sensor currents and the margin for cold mornings, and size the battery from that figure. A node that publishes every 10 seconds can draw a very different average from the same node publishing every 60.
Verify the dashboard at sea
Run a bench test first, then a supervised short field test, and compare the dashboard against independent instruments before you trust it. Start with a dry run on the bench for an hour, watching for gaps in the time series and for panels that report a value no instrument can confirm.
On the water, check timestamp alignment against an independent reference, confirm stale-data detection by unplugging a sensor, and pull the power to watch how the node recovers. If the database survives an unclean shutdown, add the supercapacitor. Check calibration against a hand-held thermometer and confirm the weather protection, cable glands and drip loops actually shed water rather than merely look convincing.
Finally, watch the dashboard while you also watch the physical instruments for a full hour. When both agree, the pipeline is finished.
Common mistakes: what breaks and how to fix it
Almost every failure on this kind of build is a naming, unit or timing mistake rather than a hardware fault. The table below pairs the symptom with the specific fix.
| What you see | What it actually means | Fix |
|---|---|---|
| MQTT messages arrive but values show as blank or 0 | The payload field name does not match the template, or the value is a quoted string | Log the raw message in Node-RED, then match the template field name exactly and publish numbers unquoted |
| Charts look flat or dead | Grafana treats the field as a string, so there is nothing to average | Use toFloat() in the Flux query and set the column type to number |
| Dashboard does not update | Refresh interval longer than the data changes, or the panel time window is wrong | Set refresh to 5 seconds for live panels and confirm the time range is relative, not absolute |
| Chart saturates into a solid block | Raw readings at 1 Hz plotted over hours | Add aggregateWindow() with a mean or max over a 1 minute window, or downsample at the source |
| Panels show impossible values | Unit mismatch, such as millivolts displayed as volts | Put the unit in the field name and set the unit on every panel |
| Multiple nodes write into one tangled series | Measurement names collide across vessels | Add a source tag per vessel and keep measurement names identical |
| Old data appears before new data | Timestamps are local or missing a timezone marker | Publish UTC with a trailing Z and let InfluxDB stamp points if no timestamp is supplied |
| Writes fail with a 400 error | Line protocol is malformed, commonly an unescaped space or a missing timestamp | Print the line before writing, check for unescaped commas in field values |
| Everything stops after a power cut | The database was killed mid-write | Add a supercapacitor or shutdown controller so the Pi powers down cleanly |
Reliable marine dashboard tips
A few habits separate a dashboard that survives a season of fieldwork from one that needs babysitting:
- Keep every timestamp in UTC, and label the dashboard with the timezone the panels render in.
- Put the dashboard JSON, the Node-RED flow export and every config file in the same repository, and commit before each field trip.
- Isolate the electronics from the vessel’s power bus and protect every connector with strain relief and a drip loop.
- Log configuration changes on the node itself, so a chart that changed shape can be traced to the commit that changed it.
- Keep alarming thresholds and advisory thresholds in separate rules, so the urgent channel stays readable.
- Back up the InfluxDB bucket and the Grafana database on a schedule and restore at least once, because an untested backup is a guess.
Frequently Asked Questions
Can a Raspberry Pi run a sensor dashboard on a boat without internet?
Yes. The Pi, MQTT broker, InfluxDB, Node-RED and Grafana all run on the local network, so live panels and historical charts keep working with no internet connection. The only thing you lose is remote access from shore. Test it by unplugging the router before you sail rather than discovering the gap offshore.
Which dashboard platform should I pick for sensor data?
Grafana suits most technical builds because it queries time series databases directly and offers panels, alerting and dashboard export. Home Assistant is a good fit if your sensors already report to it and you want control panels and history together. A custom web app pays off only when you need a specific interface, and hosted BI tools are convenient but need a permanent internet link.
Do I really need a time series database?
For a handful of readings kept for a day, a simple CSV log on the node is enough. As soon as you want charts across weeks, downsampling and alerts, a time series database earns its place. InfluxDB stores timestamped points efficiently and answers range queries fast, which is exactly the access pattern a dashboard produces.
How often should a sensor dashboard refresh?
Match the refresh interval to how fast the measurement actually changes. A temperature panel reading every 5 seconds is fine; refreshing it twice a second wastes the Pi and makes the chart unreadable. Slower values such as heading or battery voltage can refresh every 30 seconds or even once a minute without anyone noticing.
How do I calibrate sensor readings before display?
Compare each sensor against a trusted reference at known conditions, record the offset, and apply it in the Node-RED transform before the value reaches the database. Repeat the comparison monthly, because drift is what actually makes field data untrustworthy. Store the calibration constant alongside the data rather than editing panels by hand.
Can one dashboard track several boats or robots at once?
Yes. Tag every point with a source identifier, keep measurement names identical across nodes, and use an alias in each panel so the lines separate cleanly. Use a topic prefix per vessel and avoid wildcard subscriptions during commissioning so you can see which node is misbehaving.
Conclusion
Start smaller than feels productive. Pick two or three measurements that actually change the decision you are trying to make, confirm each one reads correctly at the command line, then push those values through MQTT and into InfluxDB before you build a single extra panel. Once those three fields flow end to end, adding gauges, alerts and history is the easy part.