How to detect sensor drift comes down to one comparison: read the sensor against something you trust stayed put. If the gap between them widens while the thing you are measuring holds steady, the sensor has moved. Zero drift shows up as a shifting offset, span or sensitivity drift shows up as a widening gap at the top of the range, and neither is visible in a single reading.
On a small autonomous boat the work takes an afternoon on the bench and an hour of log analysis afterwards. Teams that catch it early replace a part or re-zero a channel in the shed. Teams that don’t end up with a season of data that quietly disagrees with everything around it.
This guide walks through the detection process I use: establish a baseline you can defend, run controlled tests, compare against an independent reference, test under real conditions, look at the residuals, then set limits that tell you when to act. It works for a thermistor string on a surface drifter and for an IMU on an AUV, with the numbers swapped out for your sensor class.
Table of Contents
- What You Need
- Step-by-Step
- Common Mistakes
- Frequently Asked Questions
- What are the most common signs of sensor drift on a marine robot?
- How can I tell the difference between sensor drift and normal random noise?
- How often should marine-robot sensors be checked for drift?
- Can sensor drift be corrected without replacing the sensor?
- Why does sensor drift matter more for an autonomous sailing robot than for a handheld meter?
What You Need
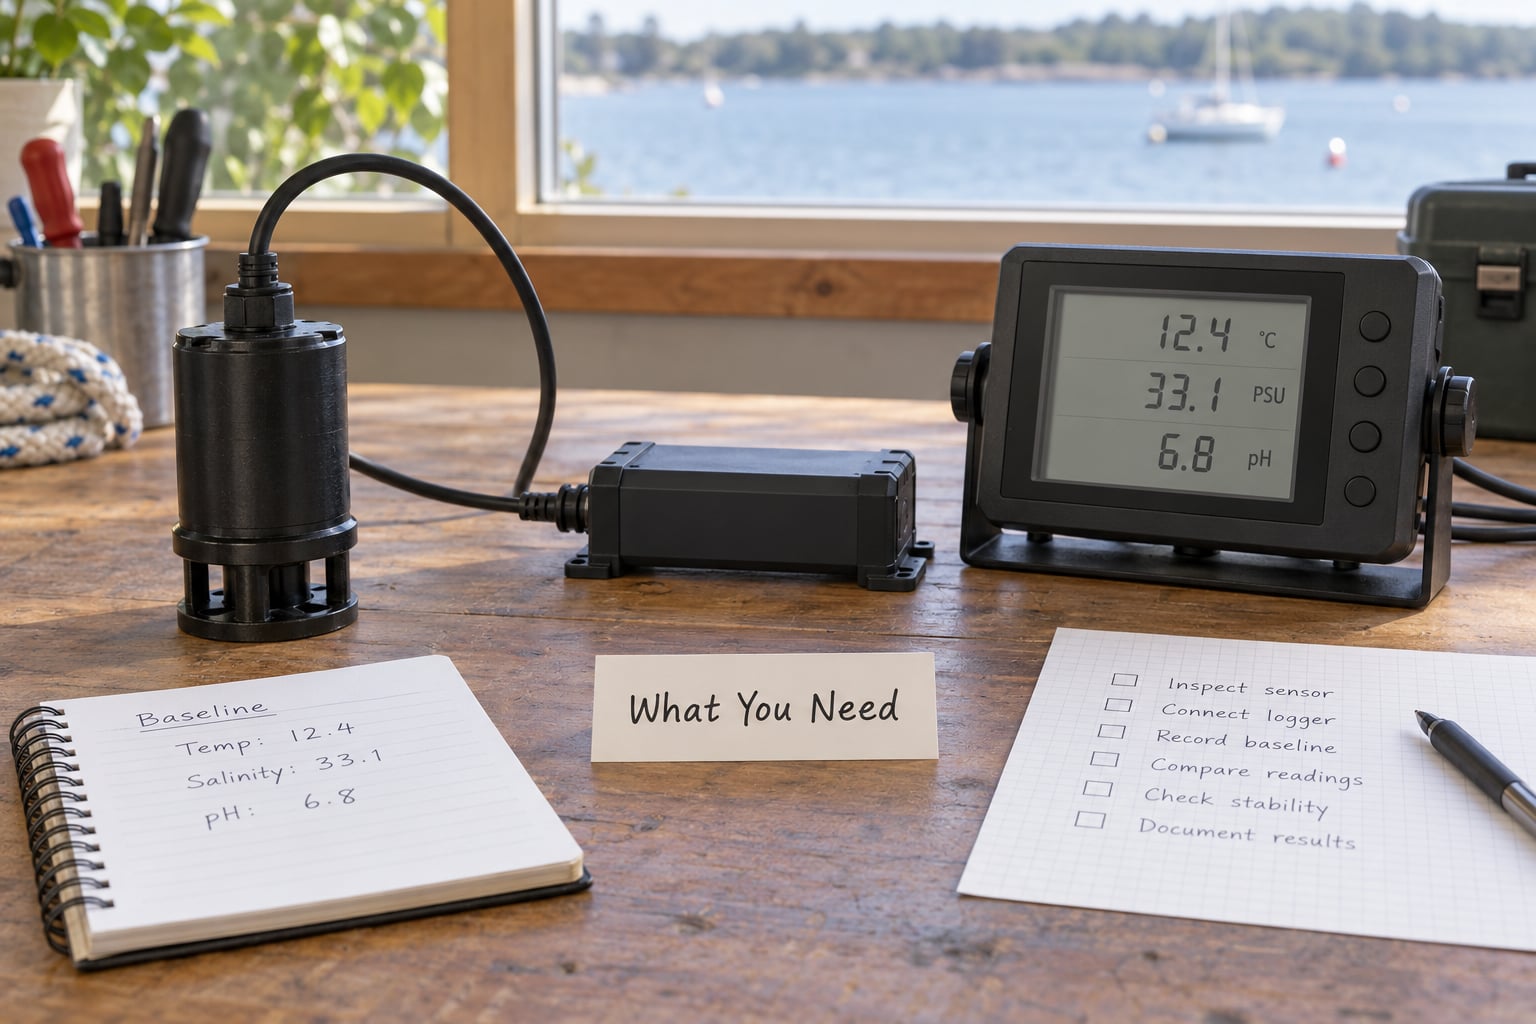
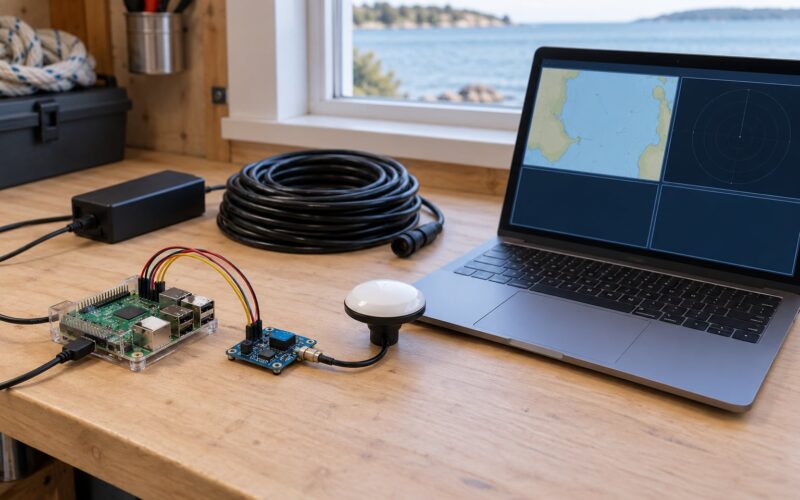
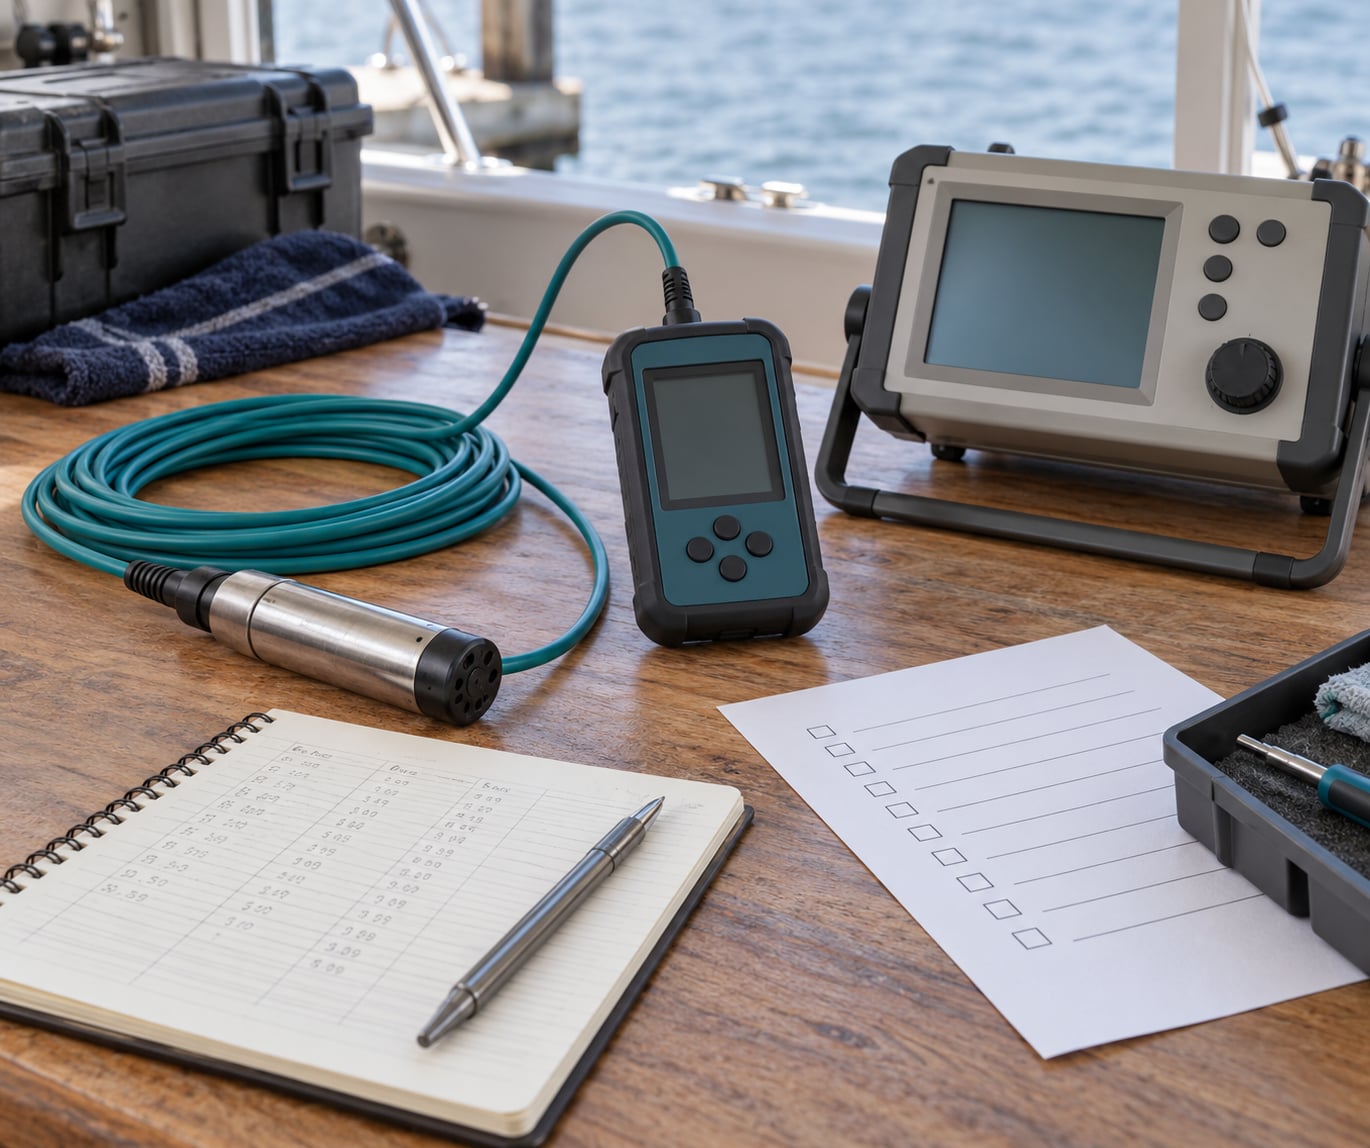
Most of what you need is record-keeping rather than hardware. The gear just has to be able to hold a condition steady long enough for you to notice a small change.
- A written baseline. The reading each channel gave on the day you commissioned it, the conditions it was taken in, sensor orientation and mounting, firmware and software version, and the expected range. No baseline, no detection — a number without a starting point tells you nothing.
- A reference you actually trust. A certified reference thermometer for the bench, a co-deployed reference probe for the field, or a repeatable physical state the sensor is known to see (an overnight zero, a saturated end point, a known depth stop). The reference has to be traceable or at least verifiable, and you need to write down why you believe it.
- A logger that timestamps everything. Raw samples, not just averaged values. Averages hide the slow ramps that are the earliest sign of drift.
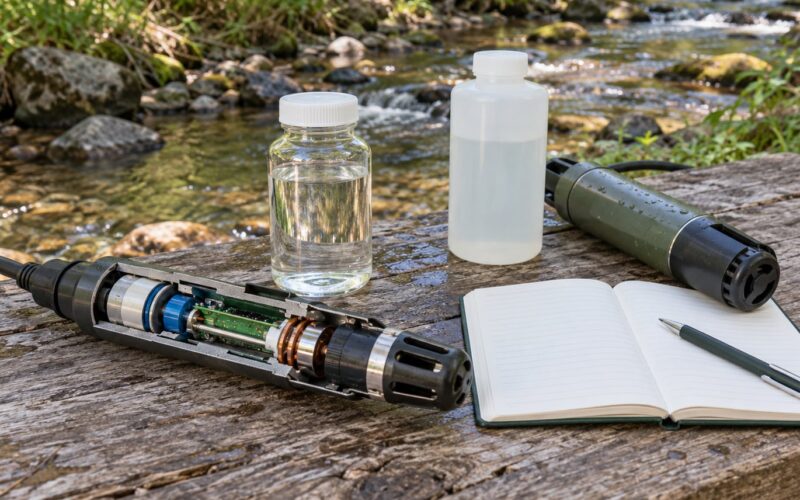
- A stable test environment. An ice bath, a stirred water bath, a stable bench at a known room temperature, or a fixed depth in a tank. If the environment moves, the test measures the environment.
- Something to hold the condition constant. A ruler, a thermocouple readout, a timer, and a way to fix the sensor in the same pose every time. Mechanical movement masquerades as drift remarkably well.
- A spreadsheet or a plotting tool. You are going to plot residuals against time at least twice a year, and a plot shows a slow slope that a table hides.
Two things worth adding if your platform runs unattended. A second sensor of the same class watching the same quantity gives you an intercomparison you never have to schedule. And a small always-on meter for supply voltage and board temperature tells you whether a “drift” is really a power or heat effect, which is a different fix entirely.
Step-by-Step
1. Establish a Stable Baseline
Capture the baseline before the robot goes in the water, and write it down somewhere that isn’t the machine. On our own builds that means a page per channel in the repo: date, ambient temperature, soak time, sensor orientation, calibration coefficients loaded, firmware commit, and twenty minutes of steady-state samples after warm-up.
Warm-up matters more than people expect. A thermistor sitting in an ice bath gives a different number in the first three minutes than in the tenth, and a conductivity cell stabilises slowly enough that an impatient reading looks like drift every single time. Log the elapsed time since power-on and keep using the same interval forever after, so your baseline and your checks are comparable.
What you should see: a baseline that is boring. Mean, standard deviation and a flat rolling mean. If the channel is already walking during the baseline capture, you have a hardware or mounting problem to fix before you start hunting for drift.
2. Run Controlled Repeatability Tests
Now put the sensor back into exactly the same condition and watch what happens. Ice-point re-zero is the classic bench test: a well-stirred bath of finely crushed ice with just enough water to fill the gaps, a sensor submerged to a fixed depth, held until the reading settles. Most temperature channels should return within their stated tolerance of 0 °C, and a repeatable offset from 0 °C is the first hint of zero drift.
A second pass gives you span. Move the sensor to a second known condition — stirred water at roughly 20 °C against a reference thermometer, or a second bath near 35 °C — and check the difference from the reference. If the offset at the low point and the offset at the high point are the same number, you have zero drift. If the high-point error is larger, you have span or sensitivity drift, and a single-point re-zero will not fix it.
Soak tests catch a third category. Leave the sensor at one condition for hours and watch the rolling mean. Electronics warm up, membranes equilibrate, pressure seals creep; a reading that moves steadily for two hours and then holds is equilibration, not drift, and the fix is a warm-up period rather than a new sensor.
Response time is worth timing too. Push a step change past the sensor and time how long it takes to settle within tolerance. A response time that has grown noticeably usually means fouling, a biofilm, or a degraded sensing element, and it changes how you interpret everything the sensor tells you later.
What you should see: repeated readings at one condition that scatter randomly inside a stable band. Random scatter is noise. A consistent offset between runs is drift.
3. Compare Against an Independent Reference
Error, bias and change from baseline all come from the same subtraction. For each check, compute the reference value minus the sensor value. Plot that residual against time and the whole picture appears: a flat line means the sensor is fine, a tilted line means drift, and a step means something discrete happened.
Lab work uses certified standards. The International Temperature Scale of 1990 gives you fixed points you can reproduce anywhere — the triple point of water at 0.01 °C, and the gallium melt point at 29.7646 °C. Checking a thermometer at both catches zero and span drift at once, which is exactly what a single ice bath cannot do. Oceanographic work pushes this much further; the widely cited accuracy target for reference-grade ocean temperature is around 0.002 °C, and reaching it means an uncertainty budget built from the bridge, the bath and the sensor itself.
At sea you rarely get a fixed point, so you use proxies instead. Deploy a reference probe next to yours and compare on the same clock. Or use a state the sensor visits predictably: a surface unit that sits just under the surface overnight sees a known near-constant temperature, and a depth sensor on a repeatable dive sees the same pressure every mission.
Intercomparison is the cheapest good method most builders never run. Two sensors of the same class, mounted 20 cm apart on the same frame, logged with the same software, tell you a lot: if they diverge, one of them has moved, and you can narrow it down by swapping which one sits where.
What you should see: residuals clustered around zero with no systematic slope. A consistent one-sided residual means the sensor has shifted relative to the reference.
4. Test Across Real Operating Conditions
Bench conditions are a filter, not the whole world. A sensor that passes at the ice point can still wander on a hull at 30 °C in a swell with the supply sagging, so test across the range the robot actually sees.
Log the conditions alongside every reading: water temperature, ambient air temperature, hull temperature, depth or pressure, vibration level near the thrusters, supply voltage, and pump or motor state. Then plot residuals against each of those in turn. Drift that tracks one of them is usually a dependency rather than aging — a thermistor with a warm-current leak, an IMU with a temperature-dependent bias, an optical DO sensor whose output follows the light level.
Contamination deserves its own treatment. A biofilm on an optical window changes both the response and the response time, and it usually arrives gradually, so it reads as drift until you check the window. Compare a wet, exposed channel with a shielded or duplicate one. On a fouling-prone mooring, a twin probe that agrees in the first weeks and splits over months is showing you the rate of biological fouling directly.
Write down conditions at the time of the check, not from memory afterwards. Half of the drift investigations I have worked through came apart once someone compared a morning bench reading with an afternoon in-water reading and realised the difference was room temperature.
What you should see: residuals that stay inside their band across the full condition range, or a clear dependence on one variable that you can compensate for or bound.
5. Analyze Residuals and Trends
This is where drift separates from noise. Noise is symmetric around the true value and re-centres over time; drift is one-sided and does not. Three quick checks do most of the work.
Split the series in half and compare the means. If the mean of the second half sits outside the spread of the first half, something moved. This is the least technical test on the page and it catches a surprising amount.
Plot a rolling average. A 20- or 50-sample moving mean over the raw samples makes slow drift obvious. Slope the fit line through it and you have a drift rate, in sensor units per day, which is the number you will eventually compare against your acceptance limit.
Run a change test. A CUSUM or EWMA statistic on the residuals flags gradual drift that eyeballing misses, because it accumulates small one-sided errors until they add up to a threshold. A Shewhart control chart with control limits drawn from your baseline does the same job for sudden steps: points outside the limits, or a run of seven on one side of the mean, mean you have a special cause. If the distributions rather than the means have shifted, a Kolmogorov-Smirnov or chi-square test on binned residuals will pick it up.
You do not need all of these. A rolling mean with a fitted slope handles most cases, and it will run in any spreadsheet or plotting library you already have.
What you should see: a residual slope near zero, and residuals that scatter on both sides of the baseline mean roughly equally often.
| What you observe | What it points to | Test that separates them |
|---|---|---|
| Same offset at low and high reference values | Zero (offset) drift | Re-zero or soak at one point; check the offset stays |
| Offset grows with the measured value | Span or sensitivity drift | Two-point calibration at both ends |
| Residuals scatter both ways, mean is stable | Normal noise, no drift | Rolling mean flat over weeks |
| Step change at a known moment | Damage, fouling event, or software update | Check logs and maintenance history against the date |
| Slope tied to temperature or power | Dependency, not aging | Plot residual against the suspected variable |
| Reading diverges from a twin probe | One channel has moved | Swap positions between deployments |
6. Set Thresholds and Decide What to Do
A detection method with no limit attached produces anxiety instead of decisions. Set a warning threshold and an action threshold per channel, in sensor units and in real units, and record the reasoning next to them. A reasonable starting point is two to three times the combined repeatability of the sensor and the reference as a warning, and roughly twice your accuracy budget as an action limit — tighten those if your mission depends on the channel, loosen them if it does not.
Then decide, in advance, what each response means. Keep monitoring when residuals sit inside the warning band with no trend. Apply a software offset when the drift is a clean, stable offset and you have a documented reference. Recalibrate when the drift exceeds the action limit, the pattern is stable, and you have a trustworthy reference to calibrate against. Isolate the channel from control loops when the residual exceeds limits but the cause is unknown — a suspect input is worse than no input on an autonomous boat. Retire the sensor when the drift is non-linear, when response time has degraded along with the reading, or when it fails twice after calibration.
Record every adjustment: date, reference used, before and after values, and the residual you observed. That record is what makes the next drift estimate short instead of starting from zero again.
| Signature | Likely cause | Next action |
|---|---|---|
| Slow constant offset over weeks | Zero drift or fouling beginning | Verify against reference, clean the sensing surface |
| Error grows with depth or pressure | Span drift or pressure compensation error | Two-point check against a depth-calibrated channel |
| Output follows light or temperature | Cross-sensitivity, warm electronics | Log the driving variable and compensate |
| Sudden jump, no ramp | Physical damage, connector, firmware change | Check logs, inspect connector, verify before trusting data |
| Residual wanders both directions, no trend | Noise or vibration | Improve mounting, check anti-aliasing, do not adjust |
| Response time growing over months | Biofouling on window or membrane | Retrieve, clean, retime response; clean on a schedule |
| One channel diverges, others agree | Single sensor fault or its wiring | Swap channel positions to isolate sensor from harness |
Common Mistakes
Judging drift from one reading. A single value carries no trend. Take at least twenty samples after a full warm-up, and compare the mean against a baseline captured the same way.
Ignoring warm-up and soak time. Most early readings are equilibration. Fix the elapsed time before power-on at the same interval for every capture, and write it into the baseline record.
Failing to document conditions. Compare a bench check at 19 °C against an in-water check at 6 °C and the difference means nothing. Log air temperature, water temperature, supply voltage and immersion state with every reading you intend to use later.
Calibrating against an unverified reference. Two sensors disagreeing tells you one of them is wrong, not which. Trace the reference back to a fixed point or a certified standard before you adjust anything to match it.
Treating software filtering as a repair. Smoothing hides the very ramps that reveal drift, and it makes your trend plots lie. Filter for control, but analyse the raw samples.
Adjusting too eagerly. Every re-zero resets your baseline and destroys the evidence of drift rate. Adjust only against a documented reference, record the before and after, and adjust far less often than you feel like it.
Forgetting the mechanical variables. A probe nudged 5 mm, a cable moved off its strain relief, or a housing reseated with a different amount of thermal paste will all read as drift. Check mounting before you blame the sensor, and mark the sensor’s position on the hull so the next person can reproduce it.
Checking once a season and calling it monitoring. Moored platforms usually get a monthly or weekly automated check that compares the channel against its baseline and flags anything past the warning band. Annual checks only catch large drift, and by then the data is already wrong.
Frequently Asked Questions
What are the most common signs of sensor drift on a marine robot?
The usual signs are a rolling mean that tilts steadily in one direction, residuals against a reference that sit consistently to one side instead of straddling zero, growing response time, and a channel that stops agreeing with a twin probe on the same frame. A sudden step rather than a slope usually points to damage or a firmware change, not drift. Check the mounting and the log file for that date before touching the calibration.
How can I tell the difference between sensor drift and normal random noise?
Split the series into halves and compare the means, then fit a line to a rolling average. Noise scatters on both sides of the baseline mean and re-centres, so the fitted slope stays near zero. Drift is one-sided and persistent, so the slope is significantly non-zero and residuals pile up on one side. A CUSUM or EWMA statistic on the residuals catches slow drift that eye-balling misses.
How often should marine-robot sensors be checked for drift?
Automated residual checks fit easily into your normal logging cadence, so weekly for a moored platform and per mission for a boat that comes back to the dock. Bench checks with a reference belong at commissioning, after any repair or firmware change, and at least twice a year. Retrieve and re-calibrate when the residual crosses your action limit, not on a fixed calendar, because fouling rate matters more than the calendar.
Can sensor drift be corrected without replacing the sensor?
Often yes, if the drift is a stable offset. Re-zero the channel against a trusted reference or store the offset in software, and record both values so the correction is auditable. Span drift needs a genuine two-point calibration and will keep coming back if the underlying cause is fouling or heat. Non-linear drift, growing response time, or a channel that fails again after calibration is the signal to replace it.
Why does sensor drift matter more for an autonomous sailing robot than for a handheld meter?
A handheld meter gets used, checked and adjusted by a person who is holding it, usually within one session. An autonomous boat has nobody watching, so the drift becomes an input to steering, station keeping or a power budget, and the error compounds over months of unattended operation. By the time the boat comes back, a small weekly bias has already shaped every decision it made.
Start with the ice bath this week, before anything else. Capture the baseline properly while the boat is still on the bench, put a second probe next to the one that matters most, and from then on let a simple rolling-mean check with a warning and an action limit run on every mission log. That combination catches most drift within weeks of it starting, which is long before it starts steering the boat wrong.