Ocean plastic cleanup systems work by putting a physical barrier or a powered intake in the path of drifting debris, letting wind and surface currents do the collecting, then lifting the plastic out of the water into storage for transport ashore. Nothing pulls plastic through a filter — every system relies on the fact that floating debris drifts, concentrates, and can be funnelled into a zone small enough to service. That simple idea has four very different engineering versions, and understanding which one you are looking at tells you what it can and cannot remove.
Most of the confusion around cleanup comes from the phrase Great Pacific Garbage Patch. There is no island of trash out there. Plastic collects in broad, diffuse convergence zones where surface currents and wind push floating material together, and the North Pacific accumulation zone holds a large share of the North Pacific’s floating debris without being remotely dense enough to walk on or scoop up. Systems designed for open ocean are built for those zones, not for a solid mass.
Roughly 11 million tonnes of plastic enter the ocean each year, against an estimated total stock somewhere between 75 and 199 million tonnes, figures published by The Ocean Movement. That gap between the tap and the bathtub is the single most important number in this whole field, and I will come back to it.
Table of Contents
- The Two Main Ocean Plastic Collection Approaches
- Where the Collection System Operates
- How Captured Plastic Is Removed and Stored
- How the Plastic Is Sorted After Collection
- How Sensors, Tracking, and Computers Guide Cleanup
- What Happens to the Plastic Back on Land
- Why Ocean Plastic Cleanup Is So Difficult
- How Much Plastic Can These Systems Actually Remove?
- How Effective Are Ocean Plastic Cleanup Systems?
- Frequently Asked Questions
The Two Main Ocean Plastic Collection Approaches
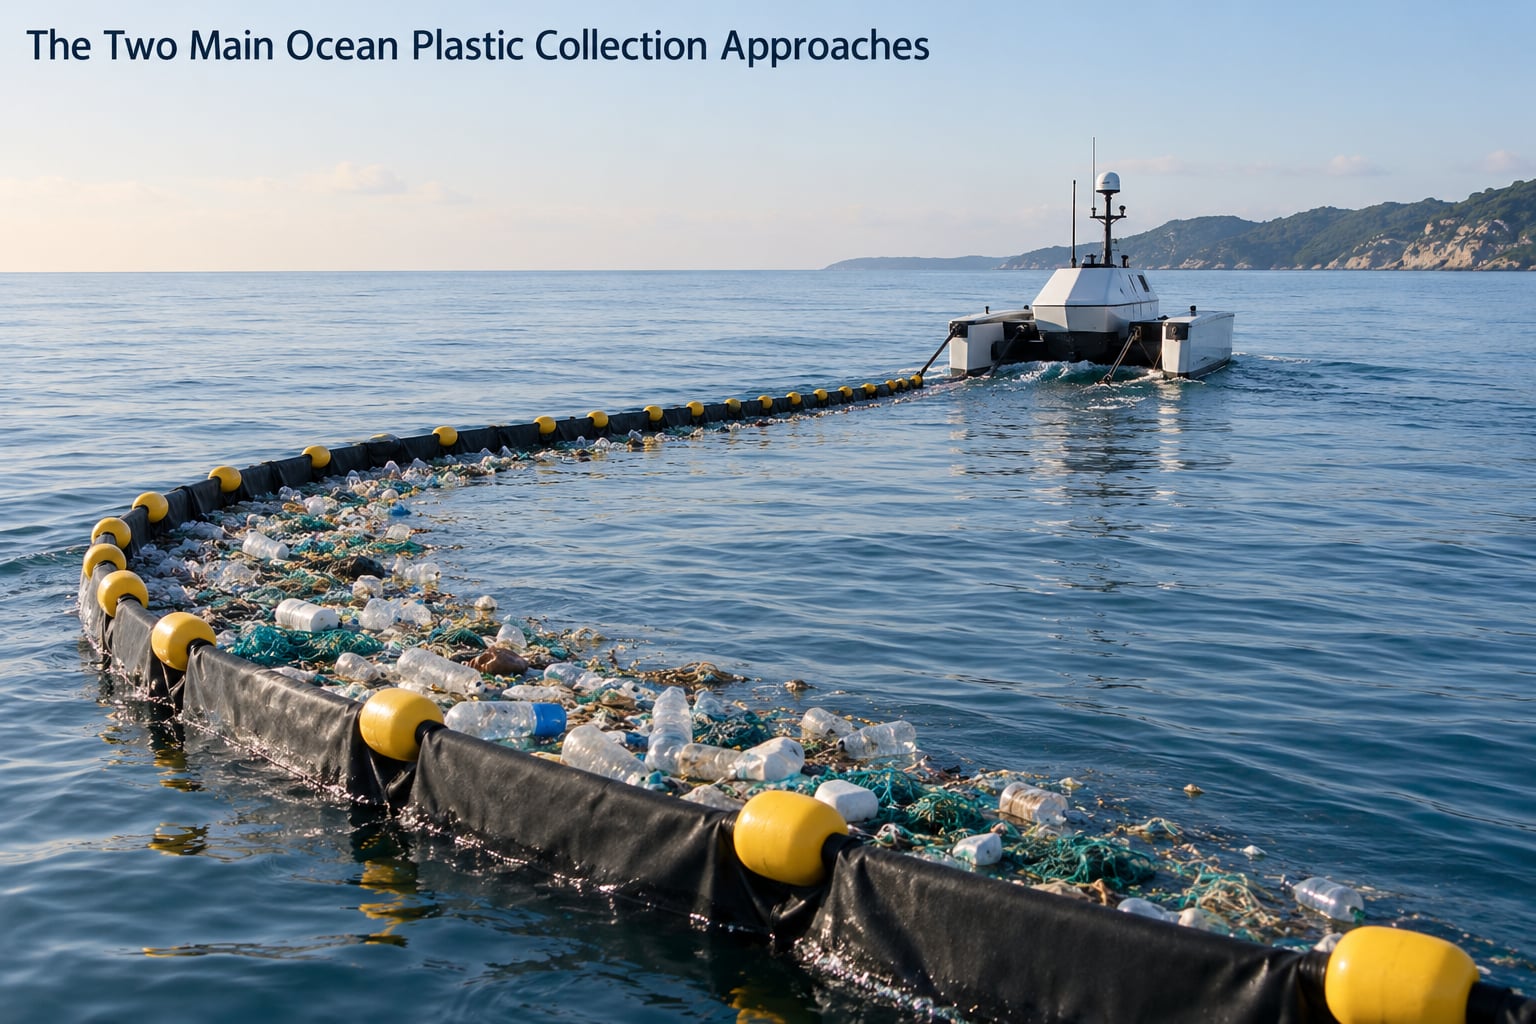
Systems split into two families: active collection, where a vessel or machine supplies the power, and passive collection, where wind and currents supply it. That single design choice cascades into everything else — where the system can sit, how much sea state it tolerates, how much debris it touches, and whether it needs a crew, a fuel budget, or neither.
| Approach | What supplies the power | Where it works | Weather sensitivity | Main trade-off |
|---|---|---|---|---|
| Passive barrier or boom | Wind and surface current | Open ocean, coastlines, large rivers | High — fails in strong crosswinds | Touches a large volume of water, so bycatch risk is proportionally higher |
| Active skimmer or powered interceptor | Onboard diesel or electric propulsion | Rivers, harbours, marina basins, coastal water | Moderate — hull and pumps need calm water | Burns fuel and needs crew, servicing and permits |
| Wheeled or gravity-fed river device | Current and river gradient | Storm drains, small rivers, urban waterways | Moderate — debris jams in high flow | Cheap to run, but jams and needs frequent clearing |
| In-situ biological or chemical degradation | Sunlight, water, microbial enzymes or catalysts | Contaminated water, sediment, shoreline soil | Low, but temperature and salinity bound the rate | Slow, hard to verify, and it works on material other systems cannot see |
The right choice follows the debris, not the technology. A river mouth concentrates a great deal of material in a small area, so a modest powered intake does more there than an ocean barrier would. Open water is the reverse — the volume is enormous, so only a system with no fuel bill and no crew can plausibly stay out for months.
How Ocean Plastic Cleanup Systems Work With Booms and Nets
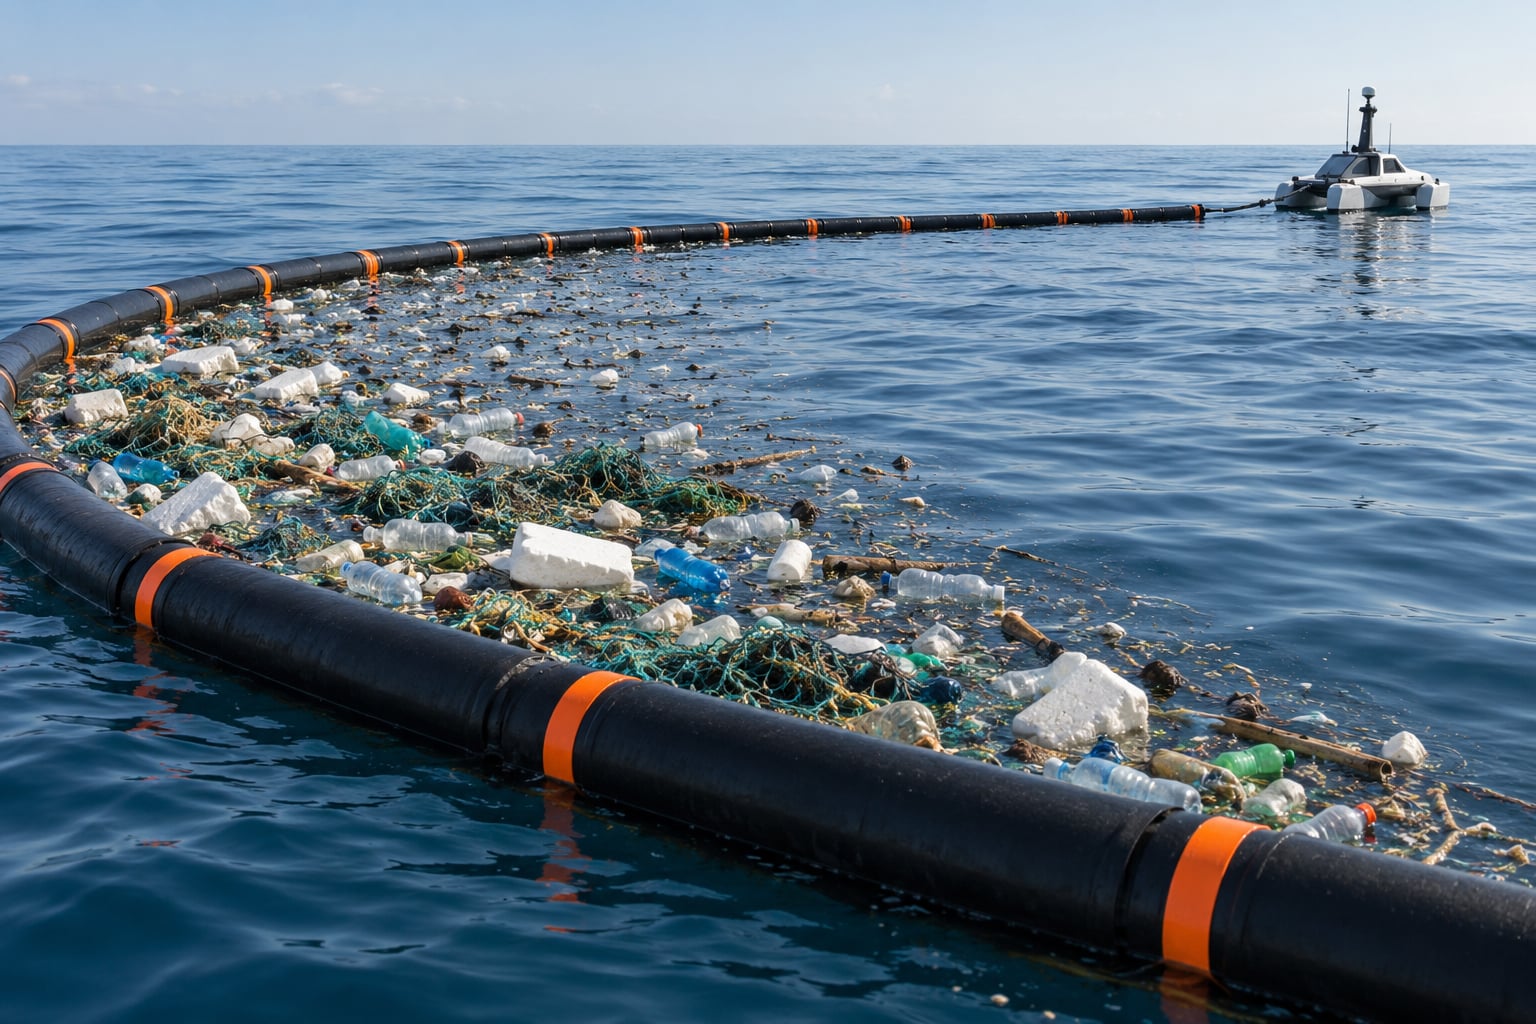
A passive barrier is a long floating line, often several hundred metres of it, towed in a broad U or V and moored at the open end so it cannot drift. Wind pushes the top of the water — and the surface plastic with it — toward the boom. Surface current pushes the underwater portion the other way, slightly. Because the floating and submerged parts of the water column move at different speeds and directions, debris at the surface is pushed toward the barrier while water slips underneath. That differential drift is the whole trick. It is why the technique is called passive remediation: no pump, no prop thrust, just an engineered conflict between two layers of moving water.
The boom itself has three working parts. The freeboard is the section standing above the waterline, and it has to stop floating debris riding over the top. The skirt hangs below, weighted with ballast chain so it forms a vertical wall and stops debris slipping underneath. The mooring and anchor arrangement holds the U open against wind and current load, which is usually the hardest part of the whole deployment — the tension in a long boom changes by the hour as weather shifts.
Once debris is stopped, it does not stay in a neat pile. It slides along the boom and accumulates at the closed end, furthest from the open mouth. That pocket is the retention zone. As more material arrives, the retention zone widens, the concentration rises, and the plastic at the outer edge is pushed down and under by newer arrivals. This is the mechanism that makes recovery practical: you are not picking items off the sea one at a time, you are building up a dense pocket of material that can be handled in bulk.
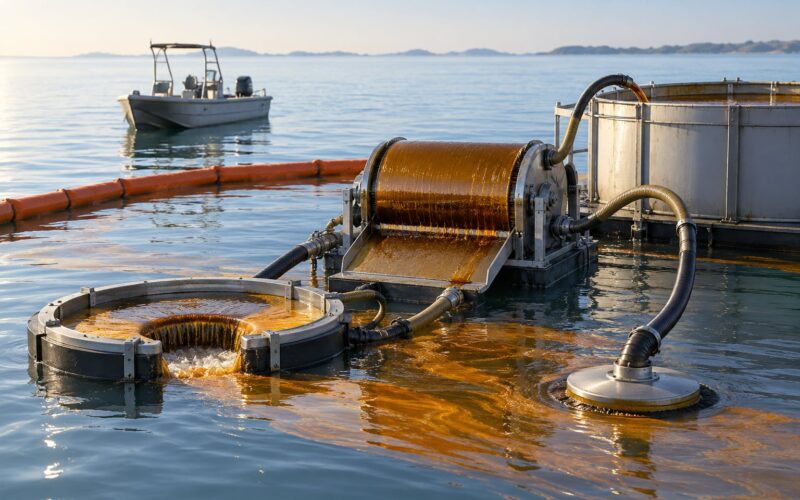
Rivers use a different geometry for the same physics. A curved boom, concave toward the flow, uses the river’s own current to sweep floating debris sideways into a collection pocket at the bank, where a conveyor lifts it onto a hopper. There is no powered debris handling in that arrangement at all. The current is the conveyor.
Where the Collection System Operates
The operating site determines almost everything downstream, because concentration, current behaviour and debris mix all change with it.
At a river mouth or estuary you get the highest concentration per cubic metre of any marine setting. Debris arrives in pulses after rainfall, mixes with organic matter, wood and leaves, and moves at whatever speed the river dictates. That density is why interception upstream is the most verifiable intervention available — a system at a river mouth can show you what it caught, and independent groups can audit it.
Coastlines and harbour entrances are a middle case. Material is pushed toward shore by wind and wave action and accumulates in bays, estuaries and marina basins, where slower water gives you a natural collection point. This is where powered skimmers and wheel-driven devices like the Mr Trash Wheel series operate, because the water is shallow, slow and sheltered enough to work a vessel safely.
Open ocean is the hardest case by a wide margin. Debris is spread across enormous area in low-concentration patches that move with wind and season. Currents at a deployment site can shift enough between one visit and the next that a system designed around one drift model ends up working the wrong patch. The marine snow and small floating organisms that live in the top few centimetres of the water — the neuston — are also concentrated at the surface, which means any system working the surface layer touches that community whether it intends to or not.
Garbage patches deserve their own note. The widely used term suggests something solid. What exists is a convergence zone with a raised average concentration of floating debris, shifting seasonally as currents and winds change. Calling it a patch is a reasonable shorthand, but it sets up the wrong mental picture, and most of the disappointment people have with cleanup results comes from expecting a beach.
How Captured Plastic Is Removed and Stored
Capture is the visible part. Getting the plastic out of the water without losing it, without breaking the equipment and without bringing a large volume of ocean water along with it, is the engineering problem that eats most of the design effort.
Recovered material arrives as a mixture of plastic, kelp, wood, foam, rope and seawater. The removal train typically runs through several stages. A conveyor carries the floating mass out of the collection zone and up out of the water. A water screen or perforated drum drains the bulk of the free water away before anything is stored. An air separator or air-knife then lifts lightweight film and foam off the heavier fraction, because a single blown bag can wrap around every moving part downstream. A shredder or screw press compacts what remains so the hopper holds more material per unit of volume.
Hoppers and storage containers come next, and the constraint here is a practical one rather than a technical one: a vessel has to return to port before it fills. Storage capacity sets the operating radius, and operating radius decides how far a system has to travel between offloads. In open-ocean operations that distance is the main operating expense after crew.
There is a hard rule buried in all of this, and it gets skipped in most explainers: only the particle sizes a system can physically handle should reach the collection mechanism in the first place. Net mesh, screen aperture and conveyor gap all define a minimum and maximum size band. Anything smaller than the mesh passes through. Anything larger than the intake can jam it or tear it. Designing for that size band is why a system tuned for one debris mix will perform poorly in another — a river full of fine film and a gyre full of ghost nets are not the same material.
How the Plastic Is Sorted After Collection
Sorting matters because the captured load is rarely homogeneous, and its composition determines whether it can be recycled, recovered as fuel, or has to go somewhere less useful.
The first split is floating versus submerged. Anything that was held under tension or entangled — fishing nets, rope, trawl warps, ghost gear — behaves completely differently from buoyant fragments. Nets arrive knotted and heavy with biofouling, and they need to be cut free and opened out before any conveyor will handle them safely.
The second split is films and fragments versus rigid items. Films, bags, wrappers and foam shred easily and are among the harder recycling streams. Rigid items, bottles and container fragments, sort more cleanly. Between them sits the worst category: mixed debris where plastics are fused with rope, netting, organic matter and metals, which no sorting line handles efficiently because it has no single material to recover.
Microplastics never appear here at all. They pass through every mesh and screen in the train and end up back in the water. The same goes for dissolved chemical pollutants and anything on the seabed. Mentioning that plainly matters, because the gap between what a system catches and what a reader imagines it catches is where most of the criticism lives.
Sorting also has to keep wildlife out of the handling stream. Anything that enters the conveyor gets carried to shore, so the design goal is to keep animals from entering in the first place. Where that is not possible, live organisms need a bypass route out of the machinery before they reach a shredder.
How Sensors, Tracking, and Computers Guide Cleanup
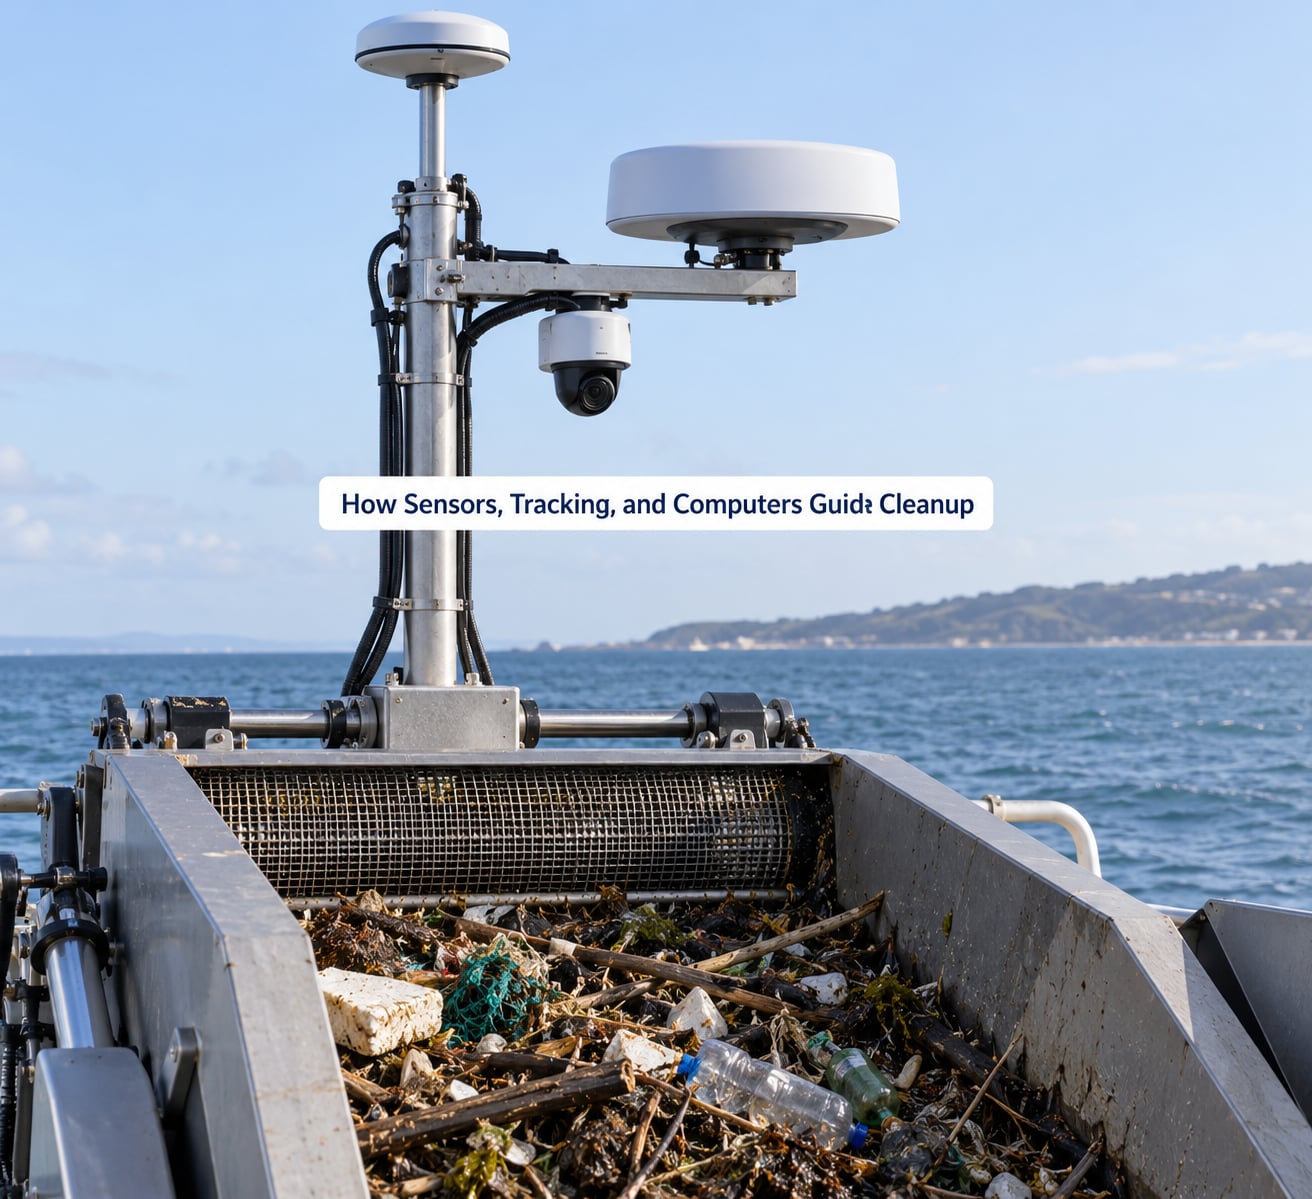
Every question about how cleanup systems work eventually arrives at the same one: how does the operator know where the plastic is before going to get it? The answer is a sensor stack, and it is doing more of the work than the marketing suggests.
Current models come first. Ocean surface drift is dominated by wind, with surface current and the Earth’s rotation layered on top. Before deploying, operators run drift modelling that predicts where a given concentration patch will be over the coming days and weeks, using forecast wind fields and measured currents. That prediction decides when to leave port and where to set the boom. Get it wrong and a month of fuel buys a week of work on empty water.
GPS and radar handle the vessel itself — position, heading, speed and collision avoidance against shipping and fishing traffic. Satellite remote sensing covers the wide area that no vessel can survey, but at satellite resolution a plastic patch is very hard to see directly, so the useful satellite contribution is usually about surface features such as slicks, fronts and current boundaries that debris accumulates against. Aerial drones cover the middle ground, giving a wide local survey at high resolution.
The most interesting sensor work is camera-based. The Automated Debris Imaging System, or ADIS, records the surface layer on video and runs computer vision over the frames to classify what is floating, which gives both a count of debris and, more usefully, a density map. It is one of the more credible answers to the recurring question of how anyone knows where the plastic is. A camera survey can also record the organisms in the same water, which means a debris count and a bycatch observation come from the same frame rather than from a separate expedition.
Everything rolls up to shore-based computers on a reporting loop. Density estimates, retention-zone contents, current drift and system position get combined to decide when to reposition a boom, when to run a recovery operation and whether the removal target has actually been met.
What Happens to the Plastic Back on Land
Offload is where a lot of the assumptions fall apart, so it is worth being blunt: collection is not recycling. A system that lifts plastic out of the water has solved a collection and handling problem. What the material becomes next depends entirely on what is in it and which processor accepts it.
The sequence on land runs: receiving and audit, sorting, baling or densifying, transport to a processor, then end treatment. The audit step matters more than it sounds, because processors need to know what is arriving before they commit to a route.
Clean, separated, single-polymer material is the only realistic recycling feedstock. That is the target. Where material arrives mixed and contaminated, the realistic routes narrow quickly. Downcycling turns it into lower-grade products that will not be recycled again. Chemical routes such as pyrolysis can handle some mixed streams and yield fuels or monomers, but they consume energy and their output is not a substitute for preventing the plastic in the first place. Mixed waste with unknown composition, and anything contaminated with biological material, is usually landfill or incineration.
Ghost gear is the one category with a clear destination when it can be identified, because usable nets and ropes can go back into fishing gear programmes. Identifying it requires a sort step that many systems do not have.
Funding follows a similar split. River programmes typically run on municipal contracts, philanthropy and corporate sponsorship, while offshore operations are funded by a mix of donations, grants and licensing recovered material. The Ocean Cleanup is a non-profit foundation rather than a commercial operator, which is the direct answer to the recurring question of whether it is for profit.
Why Ocean Plastic Cleanup Is So Difficult
Eight problems recur, and any honest explanation has to name them.
Low concentration is the first. There is no dense mass to aim at, so the physical work of separating plastic from water has to be done across a huge volume for a small return. Fragmentation is the second: plastic that spends years in sunlight and surf breaks into ever smaller pieces, so the material available at the surface is increasingly the size a mesh is designed to let through.
Uncertain movement is the third. Wind drift dominates surface transport, and a patch modelled correctly on Monday can be somewhere else by Thursday.
Storms are the fourth. A barrier under load changes shape; a boom with a long exposed span is a structural problem waiting for a gust, and recovery operations stop entirely above a certain sea state. High fuel use is the fifth, and it is why the passive option exists at all. Collisions with marine life are the sixth, and the neuston question the seventh: surface-dwelling organisms live in exactly the layer the boom is working.
The eighth is the one that gets least attention. A boom creates a slow, contained pocket of water. Small organisms gather there because that is what slow water does. Concentrating neuston in a retention zone is a real ecological effect, and it is separate from the bycatch question.
How Much Plastic Can These Systems Actually Remove?
The honest answer is that removal totals tell you very little on their own, because they depend on operating area, debris density, capture efficiency, uptime and sea conditions. The number that looks impressive on an announcement is a mass, and mass says nothing about the area it came from.
| Measure | What it actually tells you | Where it misleads |
|---|---|---|
| Total mass removed | Cumulative weight lifted out of the water | No area, no time baseline, no comparison against inflow |
| Capture efficiency | Share of debris passing a section that ends up retained | Rises with how concentrated the water is; rarely comparable between sites |
| Uptime | Share of available time the system is deployed and working | Storm downtime and servicing time are often excluded |
| Daily throughput | Peak handling rate at the recovery stage | Peak is not average; it is a machine specification, not a field result |
| Area covered per year | Surface area actually swept | The only number that scales against an estimated stock, and the one rarely published |
| Cost per tonne | Operating cost divided by tonnes removed | Hides the carbon and vessel-hour cost that does not appear in the invoice |
The scale arithmetic is where this gets uncomfortable, and it comes from Slate’s January 2024 reporting, so treat the figures as dated. Running roughly 200 devices continuously for 130 years would remove about five percent of the floating plastic in the ocean. Against an estimated inflow of about 11 million tonnes a year, that is a rounding error either way.
That does not make the work pointless. It makes it a supplement. The most defensible use of mechanical capture is where it is dense enough to be economical: rivers, harbour basins, urban waterways and concentrated neuston-adjacent debris near coastlines.
How Effective Are Ocean Plastic Cleanup Systems?
Judged on their own terms they work reasonably well. These are real machines, operating in real conditions, removing material that would otherwise be at sea, with published totals and published criticism. The Ocean Cleanup has reported removing 50 million kilograms of plastic from the ocean, a figure attributed here to the organisation rather than independently verified.
Judged against the total problem, they are marginal. On bycatch, the clearest published comparison for The Ocean Cleanup’s systems covers July 2021 to December 2023: 152,397 kg of plastic against about 1,300 kg of bycatch. That is a low ratio and worth noting, but a University of Plymouth study of Seabin harbour units found roughly one organism per four plastic pieces, which is a much less comfortable number in a contained basin. Different device, different environment, different result. Nothing in the public data lets you combine them into one verdict, and anyone who does is oversimplifying.
There are real costs too. Vessel fuel burn, the carbon in tow materials and the disturbance to the surface layer all sit on the other side of the ledger, and published work on carbon cost argues these are substantial rather than marginal.
So the sensible reading is: cleanup is worth doing at the points where debris is dense enough for a machine to be efficient, and worth doing transparently with environmental impact assessments and bycatch data published alongside removal totals. Prevention still dwarfs it. Upstream interception, waste infrastructure in places that lack it, and source reduction change the inflow; removal only ever addresses what has already arrived. Cleaning what is there while the tap stays open is a systems problem, not an engineering one.
The useful question to ask of any cleanup system is not how impressive is its removal total. It is how much area it covers per year, what its bycatch rate is, and what happens to the material afterwards. Systems that publish those three numbers are worth taking seriously. Systems that publish only the total are selling something.
Frequently Asked Questions
Do ocean plastic cleanup systems collect all types of plastic?
No. Almost every system targets macro-debris: bottles, fragments, foam, films and fishing gear in a defined size band. Microplastics, dissolved chemical pollutants and anything on the seabed pass straight through. Net mesh and screen aperture set that size band, so debris either smaller than the mesh escapes or larger than the intake jams the machinery. Readers should treat removal totals as a figure for floating macro-debris only, not for plastic pollution as a whole.
What happens to microplastics and fishing nets?
Microplastics are not captured by mechanical systems at all, which is the most common complaint raised about this technology. Fishing gear is the opposite case: nets, ropes and trawl warps capture well because they are large and buoyant, and identifiable gear can be cut free and routed into gear recovery programmes once ashore. The difficulty is sorting: gear arrives knotted, heavy with biofouling and often fused with plastic fragments, which is why most systems cannot separate it on the water.
Are autonomous cleanup vessels safer or cheaper than crewed boats?
On cost, usually yes: a passive barrier needs no fuel budget and can stay deployed for months, which is the only reason large open-ocean systems are conceivable at all. On safety, it is mixed. Removing people from the water removes crew exposure to bad weather and heavy lifting, but an unmanned surface vessel still has to share the sea with commercial shipping and fishing traffic. Collision avoidance, weather limits and the need to recover a damaged unit all stay on the books either way.
Can cleanup equipment harm marine wildlife?
Yes, and this is an active scientific dispute rather than a settled question. Bycatch, meaning incidental capture of non-target organisms, has been reported in published data: a Plymouth study of Seabin units found roughly one organism per four plastic pieces, while The Ocean Cleanup’s systems reported about 1,300 kg of bycatch against 152,397 kg of plastic between July 2021 and December 2023. A second, subtler effect is that a boom creates a slow pocket of water where surface organisms gather.
Why has ocean plastic not already been removed?
Because of arithmetic more than engineering. An estimated 11 million tonnes of plastic enter the ocean each year against an estimated stock of 75 to 199 million tonnes, and surface debris is spread across enormous areas at very low concentration rather than sitting in a solid mass. Scale estimates reported in 2024 suggest that even two hundred large systems running continuously for 130 years would clear only about five percent of the floating plastic. Prevention changes the inflow; removal can only ever chase what already arrived.
If you are evaluating a system for real, start with the three numbers most reports leave out: area covered per year, bycatch rate, and where the material ends up. Everything else follows from those.