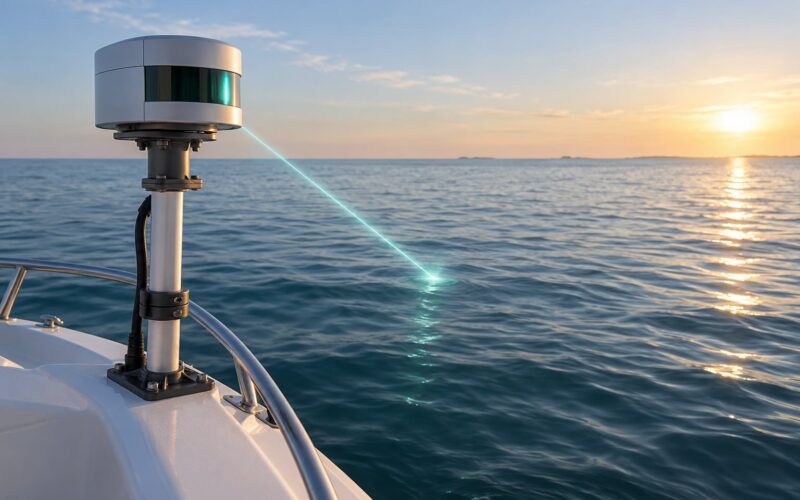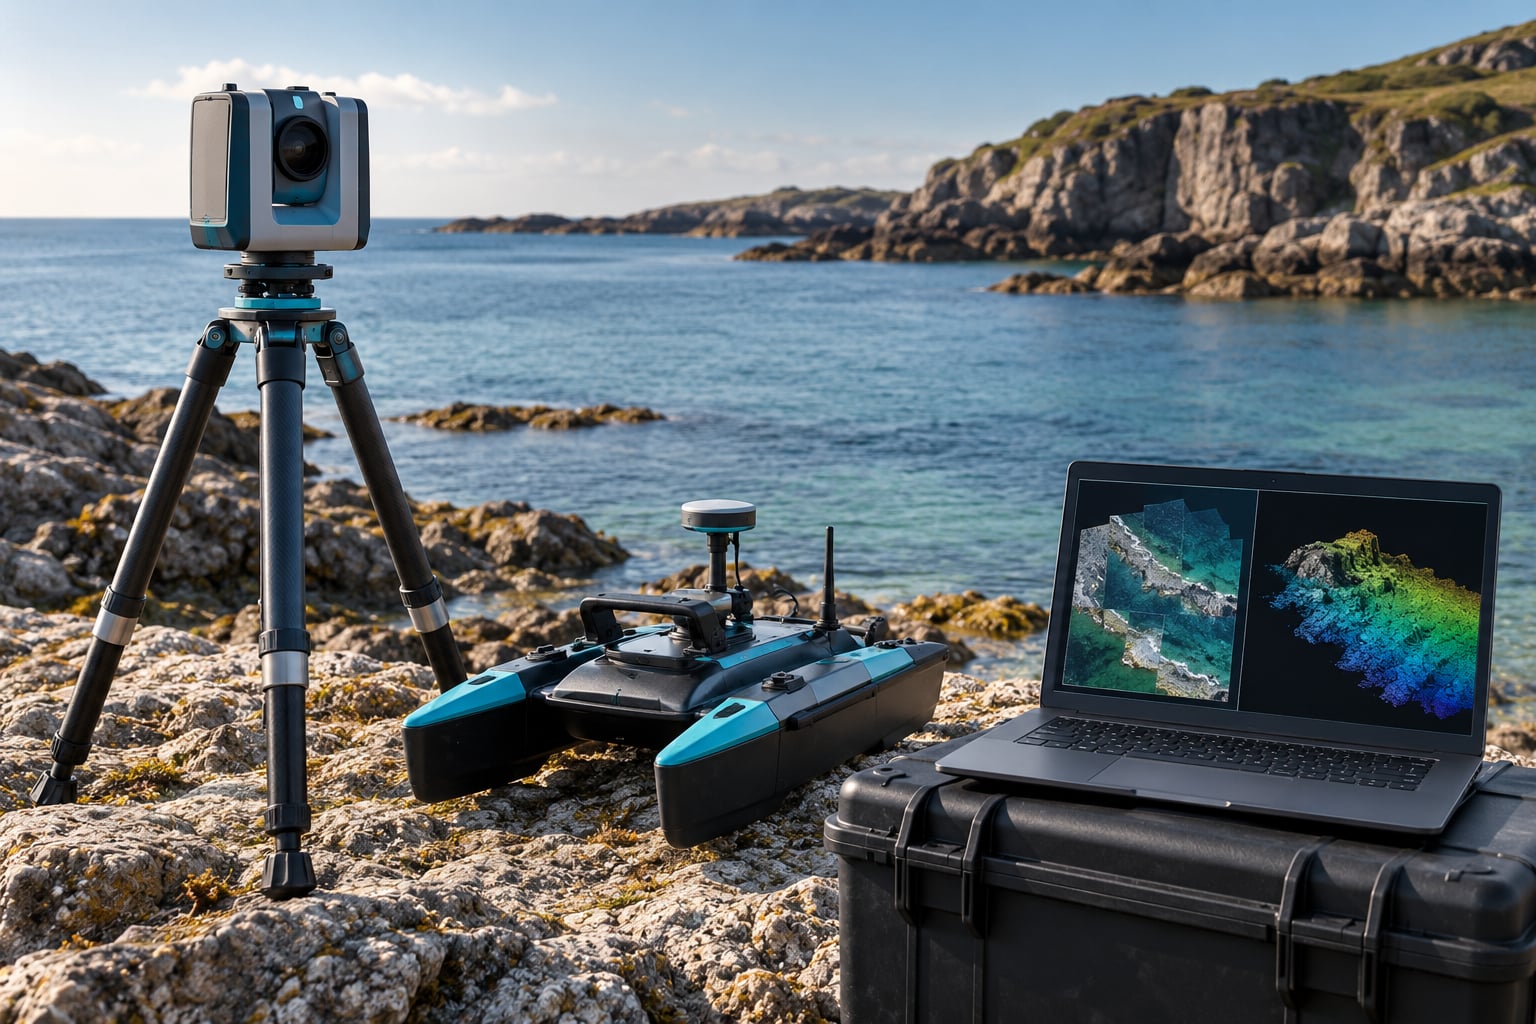
Photogrammetry turns overlapping photographs into measured 3D data. Software finds the same feature, a boulder edge or a roof corner, across many images, measures how far it shifts between shots, and uses that shift to work out where the camera stood and how far away the feature is. Those measurements become point clouds, orthomosaics and terrain models, tied to a real coordinate system.
That is the whole trick, and it is worth answering the question directly: how photogrammetry works for mapping is a problem of measuring how much the view changes between shots, then turning that change into distance. The rest of this guide is the detail: what gets captured, how the geometry is solved, what comes out, how accurate you can claim it is, and where it falls apart. I have framed it around marine robotics and field survey work, because that is where the failure modes are most interesting.
Table of Contents
- What Is Photogrammetry and How Does It Create a Map?
- How the Photogrammetry Mapping Process Works
- What Can Be Mapped With Photogrammetry?
- How Accurate Is Photogrammetry for Mapping?
- How Is Photogrammetry Used for Marine and Environmental Mapping?
- What Software and Hardware Do You Need?
- How Can You Improve a Photogrammetry Survey?
- When Should You Use Lidar Instead of Photogrammetry?
- Frequently Asked Questions
- Conclusion: Start With Measurement Quality, Not Just More Images
What Is Photogrammetry and How Does It Create a Map?
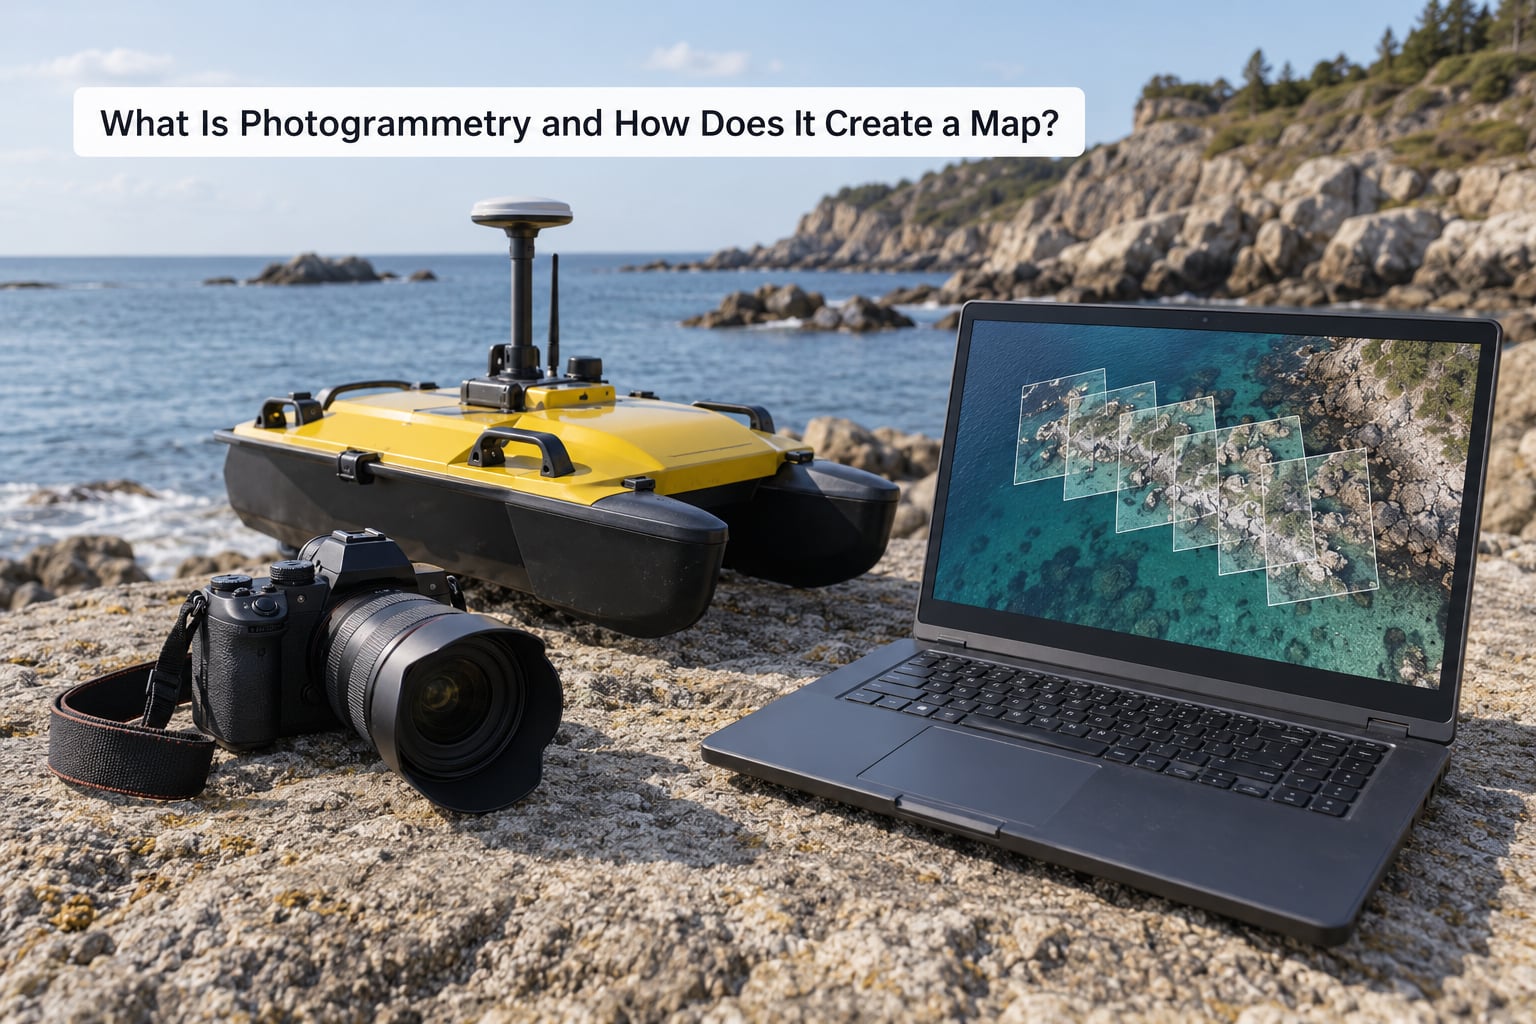
Photogrammetry is the science of measuring distance and 3D shape from ordinary photographs. Instead of a laser or a depth sounder, it uses the way a scene changes appearance as you move past it. Walk ten metres along a shoreline and photograph the same rocks, and the near rocks shift sideways across your field of view while the distant cliff barely moves.
That differential shift is parallax, and it is the entire physical basis of the technique. The distance between two camera positions is called the baseline. With a known baseline and a measured shift, you get a depth estimate through simple triangulation, the same geometry a land surveyor would use.
It is worth being clear about how this differs from the other two things people lump it in with. Lidar measures distance directly with a laser, so it works on surfaces where a camera cannot see anything: dense canopy, mud, bare rock at night, black water. Satellite and aerial imagery is photogrammetry too, just from a very different platform, which is why the term covers everything from a drone grid to a planetary lander.
What photogrammetry gives you that a laser cannot is texture and colour on every point, at almost no extra cost, plus a fully reconstructible 3D object rather than a scatter of returns. What lidar gives you that a camera cannot is a measurement on a surface with no visible texture at all.
How the Photogrammetry Mapping Process Works
Every mapping workflow, whether the images come off a multirotor, a fixed-wing aircraft, a handheld rig or an autonomous surface vehicle, runs through the same six stages.
- Capture overlapping, geotagged images. Fly a planned pattern with roughly 80 percent forward overlap and 70 percent side overlap, at a steady altitude and speed, with exposure locked if the software allows it.
- Detect features in every image. Software searches each frame for distinctive corners, edges and texture patterns and records their pixel coordinates. These keypoints are the things it can recognise again later.
- Match features across images. Each keypoint is compared with keypoints in neighbouring frames to build a network of tie points, where one measured point is seen in several images.
- Solve for the cameras. Triangulation gives a first camera solution for position, orientation and focal length, then bundle adjustment refines every camera and every tie point together until the reprojection error is as low as it can go.
- Run dense image matching. Rather than measuring only the keypoints, the software estimates depth for nearly every pixel and turns the result into a dense point cloud.
- Georeference and export. GNSS positions, ground control points or both anchor the model to a named coordinate system and datum, and the software exports orthomosaics, DEMs, DSMs, point clouds and textured meshes.
How Overlapping Images Become 3D Measurements
Step three is where the real work happens. Imagine a boulder on a tidal flat photographed from a small survey boat, with a stable mount and the camera firing every two seconds. The boulder edge, a patch of lichen, the corner of a marker post, each shows up as a keypoint in frame after frame. The matcher links the ones it can identify with confidence.
With enough links, the network is over-constrained, which is the important part. If a feature is seen in five images, five different viewing angles constrain its position. That redundancy is what lets bundle adjustment push residual error down, and it is why adding a low-quality image can make a reconstruction worse rather than better.
The result at this stage is a sparse cloud of a few thousand to a few hundred thousand tie points, accurate but not detailed. Dense matching then estimates depth for almost every pixel, producing millions of points. It costs far more compute than the sparse step, and it is the stage most likely to produce noise over water, sand and shadow.
How Camera Geometry and Ground Control Affect Accuracy
Until control is applied, the reconstruction is a relative, scale-free shape. Bundle adjustment will happily produce a perfectly formed boulder sitting somewhere in an unlocated coordinate space. It has no idea how big a metre is or where on Earth it is.
Two things fix that. GNSS on the camera gives every image an approximate position, which supplies scale and coarse location but carries metres of error on a normal receiver and is degraded further by multipath near cliffs and structures. Ground control points, surveyed to centimetre accuracy and physically marked on the ground, anchor the bundle to a real datum and pull the whole network into place.
A useful diagnostic: a reconstruction can look flawless and still be metres off. Visual quality tells you the internal geometry held together. Only an independent check point, one that was not used in processing, tells you where the model actually sits on the ground.
What Can Be Mapped With Photogrammetry?
The input is the same set of photographs for every output below. What changes is the product the software builds from the dense cloud and how it is resampled.
| Output | What it is | What it is for |
|---|---|---|
| Point cloud | Millions of measured points, each with X, Y, Z and colour | Volumetrics, stockpiles, structural deformation, asset inspection, and as the base for everything else |
| Textured mesh | A triangulated surface with photographs draped over it | Visualisation, digital twins, hull and wreck models, simulation inputs |
| Orthomosaic | A single distortion-free, georeferenced image corrected to a chosen map projection | Measurement and annotation, weed and erosion mapping, baseline records |
| DSM | Digital surface model: first surface hit, including canopy, buildings and structures | Volumetrics, flood modelling, line-of-sight work, vegetation height |
| DEM / DTM | Bare-earth model with structures and vegetation removed | Hydrology, drainage design, contour generation, cut and fill against a design surface |
A point cloud and an orthomosaic answer different questions. The point cloud keeps vertical detail and is where measurements come from; the orthomosaic flattens everything to a plane, which makes it the right format for reading features off a map but wrong for anything about height. Producing a bare-earth DTM from vegetation is a classification job, and it fails where the canopy is too thick to see ground through.
Two more products are worth knowing. Volumetrics come from comparing surfaces: a baseline surface against a current one gives stockpile or cut-and-fill volumes. Repeat surveys of the same ground on different dates give change maps, which is how erosion and shoreline movement get measured rather than estimated.
How Accurate Is Photogrammetry for Mapping?
Accuracy is driven less by camera megapixels than people expect, and far more by geometry, control and light. The rule of thumb in the field is that the best achievable accuracy is one to three times the ground sampling distance, where GSD is the real-world size of one pixel.
| Factor | Effect on accuracy |
|---|---|
| Flight height and GSD | Lower altitude gives finer GSD and usually better results, at the cost of more images and more flying time |
| Forward and side overlap | Too little overlap and the network is weakly constrained, so cameras cannot be solved and the model bows or tilts at the edges |
| Camera and lens | Uncalibrated lens distortion leaves systematic height errors, most visible on flat surfaces like roofs and decks |
| Exposure and shutter | Rolling shutter during turns bends the reconstructed surface; auto-exposure shifts brightness and costs you matched features |
| GNSS quality | Onboard position fixes scale and rough location; multipath and poor constellations degrade every camera position |
| Ground control | Six or more well-surveyed control points, spread across and around the block, dominate the final absolute accuracy |
| Lighting and surface | Midday light shortens shadows; water, wet sand, glare and repetitive texture break feature matching outright |
Two distinctions matter when you report a result. Relative accuracy describes how well points agree with each other inside the model, and it is usually excellent. Absolute accuracy describes how well the model sits in the real world, and it is limited by your control. Horizontal and vertical error also behave differently: vertical is typically two to three times worse than horizontal, because a depth error propagates from the angle you measured it at rather than from distance.
The honest way to state accuracy is a root mean square error, in centimetres, against independent check points that were not used in processing. A published figure with no stated method tells a reader nothing.
A worked example. A 20-megapixel camera with a 1/1.7 inch sensor flying at 120 m above ground level gives roughly 3 cm GSD. Apply the one-to-three-times rule and you land on an expected horizontal error of about 3 to 9 cm, before control is considered. One published case study flies that exact pattern over 320 to 700 ha in a 30 to 45 minute sortie with 80/70 overlap and reports a 5 cm DTM and a 3 cm true orthophoto, validated against check points rather than assumed. Another, more modest, claims around 8 cm with entry-level equipment. The gap between those two numbers is almost entirely control quality, not camera quality.
How Is Photogrammetry Used for Marine and Environmental Mapping?
Coastal and shallow-water work is where photogrammetry earns its keep, and it is also where it is most often misused. Intertidal zones, reef flats, wreck sites and eroding dunes are all mapped by flying low line patterns, triggering images at fixed intervals, and processing with control painted on stable hard points or on fixed structures rather than on sand.
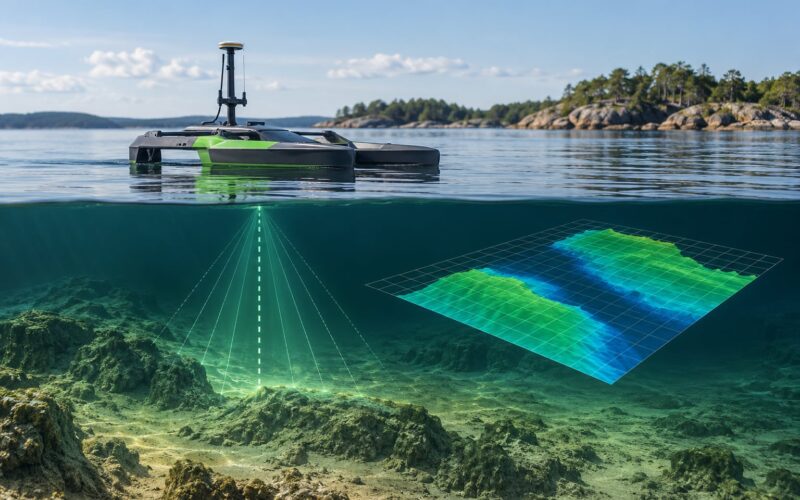
Shoreline change is the clearest application. Survey the same transect each year, register the surfaces, and the difference between them is measured erosion rather than an estimate from a photograph. Habitat mapping works the same way: a low-tide grid captures the seabed, and a classification pass turns the point cloud into substrate labels.
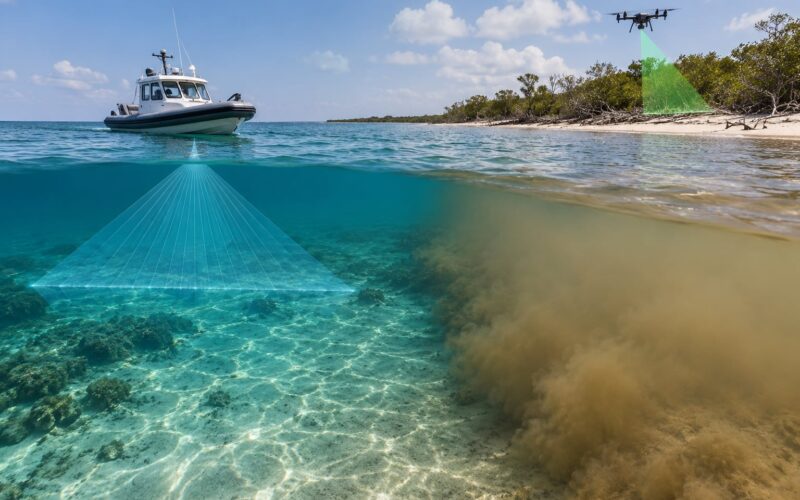
The honest caveats are worth stating plainly. Water absorbs and scatters light, so deep or turbid water returns nothing usable and the reconstruction simply fails there. Underwater photogrammetry works in clear shallow conditions with a calibrated housing and a strobe array, because light must travel twice through water and the refractive index change bends the apparent path, so the geometry needs correcting before distances are meaningful.
Waves and swell add a second problem. A vessel-mounted camera is never still, and heave, roll and pitch mean the camera solution is only as good as the platform model. On an autonomous surface vehicle the same effect appears as a systematic tilt or a stepped surface if position is interpolated between GNSS fixes rather than tied to the shutter event.
Vegetation is the other hard limit. A camera sees leaves, not the ground under them, so a photogrammetric surface model in dense marsh or canopy is a canopy model. Where a bare-earth model is genuinely needed, that is a lidar job.
What Software and Hardware Do You Need?
Hardware is less specialised than the workflow suggests. You need a camera with a known, fixed focal length, a platform that holds a repeatable geometry, a positioning source, and enough light to keep shadows short. Everything else is a preference.
- Camera. A manual-focus, fixed-lens body is the workhorse because autofocus hunting and zoom rings both break the calibration. Resolution matters less than control.
- Platform. Multirotors hold a tight grid over small or steep sites. Fixed-wing aircraft cover hundreds of hectares per flight. A boat, a hand-held pole or an autonomous surface vehicle all work if the platform geometry is stable or known.
- Positioning. A real-time kinematic or post-processed kinematic receiver supplies corrected GNSS positions per image. Check point sets, surveyed independently, supply the proof.
- Control. Targets and painted marks, distributed rather than clustered, and measured by a receiver tied to a national network.
- Processing. Desktop platforms handle full survey jobs, cloud services handle volume, and open-source pipelines cover everything from a laptop check to a distributed cluster. Pick by dataset size and how much you need to intervene in settings.
Compute is the hidden requirement. A few hundred images produce a manageable point cloud. A few thousand, with dense matching, routinely generate tens of gigabytes and hours of processing on a workstation-class machine, and a large block will saturate anything smaller. Plan storage and processing time before the flight, not after.
Tooling churns fast, so treat these as workflow types and check the current release in 2026 before committing to one.
How Can You Improve a Photogrammetry Survey?
Accuracy gains come from the flight plan and the control, in roughly that order. Seven changes cover most of it.
- Fly lower for the GSD you need. Halving the altitude roughly halves the GSD and the expected error, at the cost of more images.
- Hold overlap above the target. Keep 80 forward and 70 side as a floor, and add more over water, sand and shadow.
- Vary the viewing angle. Add a second pass at an offset angle or a lower oblique line so vertical faces and overhangs are seen directly rather than guessed at the edge of a block.
- Lock the settings. Fixed exposure, fixed white balance, fixed shutter and focus, and a fast enough shutter to avoid motion blur during turns.
- Keep the flight planar. Constant altitude and speed, with the terrain following rather than the aircraft riding a contour. Non-planar flight is the single most common cause of a bowled or tilted surface.
- Distribute your control. Six or more points, spread around the edges and across the middle, not clustered near one corner. Practitioners consistently report that control count and spread dominate camera resolution.
- Fly check points and keep the flight log. Reserve a few survey-grade points for validation only, and record altitude, overlap, sensor, flight time, area and image count. The log is what makes the result defensible.
The mistakes that recur on forums like the Agisoft board and r/UAVmapping follow the same pattern. Skimpy overlap produces edge-of-block distortion on longer flights and over rolling terrain. Uncalibrated lens distortion leaves systematic height errors on flat surfaces. Water, wet sand, reflective metal and repetitive textures such as tiled roofs or crop rows break matching in ways no amount of post-processing fixes. Large datasets fail to align outright when a flight mixes wildly different exposures, and users report alignment failures on sets of around 1,200 images from a single aircraft flown with a mixed setup.
Another one worth naming: a block of imagery processed with no geotags at all usually cannot be georeferenced afterwards, because the scale and the reference frame are gone. Solve positioning at capture, not at the office.
When Should You Use Lidar Instead of Photogrammetry?
Use lidar when the target surface has no texture, when you need to see through vegetation, or when the vertical tolerance is tight. Use photogrammetry when you need colour, when the surface is bare and well-textured, and when speed and area coverage matter more than absolute vertical precision.
| Consideration | Photogrammetry | Lidar |
|---|---|---|
| Surface with no texture | Fails or produces noise | Measures regardless of colour or texture |
| Dense vegetation | Models the canopy, not the ground | Returns ground and canopy separately |
| Colour and texture | Full RGB on every surface | Intensity values only, unless fused with imagery |
| Night or heavy cloud | Not possible | Works in darkness; cloud still blocks it |
| Water surface | No return, holes in the model | Also weak, but can be more tolerant in choppy conditions |
| Typical vertical error | Often 1 to 3 times GSD with good control | Comparable, and independent of GSD |
| Area coverage per hour | High | Lower |
A practical rule for marine work: photogrammetry for the intertidal zone, the shallow bottom in clear conditions, and anything you need colour for, such as substrate mapping and habitat classification. Lidar for deep channels, murky water, structures surrounded by vegetation, and any surface that will be measured against a tight vertical tolerance.
Frequently Asked Questions
Do you need GPS data to make a photogrammetry map?
Yes, if you want a map in real-world coordinates. Without positioning the software can still reconstruct a correctly shaped 3D model, but it will be arbitrarily scaled and unlocated, so you cannot overlay it, measure volumes, or georeference it later. The question behind how photogrammetry works for mapping is really about where each camera stood. GNSS on the camera gives scale and rough position; surveyed ground control points give the centimetre-level anchor.
How many photos are needed for photogrammetry mapping?
Enough to keep every surface seen in at least three frames, which in practice means heavy overlap rather than a fixed count. A 20-hectare site flown at 120 m with 80 percent forward and 70 percent side overlap on a 20-megapixel camera typically lands between 400 and 800 images. A single landmark close to the camera can technically work for a small object, but nothing reliable.
Can photogrammetry map underwater terrain?
Yes, within limits. Underwater photogrammetry works in clear, shallow, calm conditions with a calibrated housing, a strobe or continuous lighting, and a refractive index correction to account for light bending at the water surface. Beyond roughly 10 to 15 metres, or in anything turbid, there is not enough usable light returning. A submerged camera also cannot see the seabed directly beneath itself, so the flight has to be offset and tilted.
What is the difference between a point cloud and an orthomosaic?
A point cloud keeps every measured point in 3D, so it carries height, volume and structural detail. An orthomosaic flattens the scene onto a plane and stitches the photographs into a single georeferenced image with no perspective distortion. Use the point cloud to measure, and the orthomosaic to read, annotate and compare. One is a measurement product, the other is a picture you can measure on.
How do you georeference a photogrammetry map?
You supply the correspondence between image positions and real-world coordinates. In practice that means a set of surveyed ground control points whose coordinates in the images you mark, plus the GNSS positions stored with each photo. Processing solves the camera network in that reference frame, and you state the coordinate reference system and datum explicitly. Always keep some surveyed points out of processing and use them to check the result.
Conclusion: Start With Measurement Quality, Not Just More Images
The mechanism in one line: overlapping images give you parallax, parallax gives you depth, and depth plus camera position gives you a measured model rather than a photograph of a place.
Decide the output before you fly, choose surfaces with measurable texture, plan the camera geometry and the overlap around the accuracy you need, and decide how you will validate the result before the first image is taken. Everything else is a detail that a processor can fix. Those three decisions are the ones that decide whether the survey is worth flying.